Jim Nielsen, Founding Software Engineer
May 5, 2023

*** NOTE ***This post outlines our initial theory on how we felt building a coordinate system should work on an infinite grid. However, we have since changed our approach (based on user feedback) to a coordinate system based on A1 notation. We hope you enjoy as it's great read, and a testiment that sometimes you just have to build something to see if it works.
Learn more about our community-led product roadmap.
At Quadratic, we’re working on building a programmable spreadsheet with an infinite canvas. This allows you to zoom in and out, pan around, and structure data in a way that is contextual to you and the relationships in your data.
This approach mixes various familiar paradigms across traditionally disparate tools, such as A1 cell reference notation from spreadsheets, a large coordinate system from infinite canvas tools, and zero-based numbering from programming. This mixing often results in conflicting interaction paradigms which necessitates designing and building new ones.
This post is meant to give insight into how Quadratic works and what kinds of problems we are encountering in building the first infinite canvas spreadsheet.
Grid systems: traditional spreadsheets vs. an infinite canvas
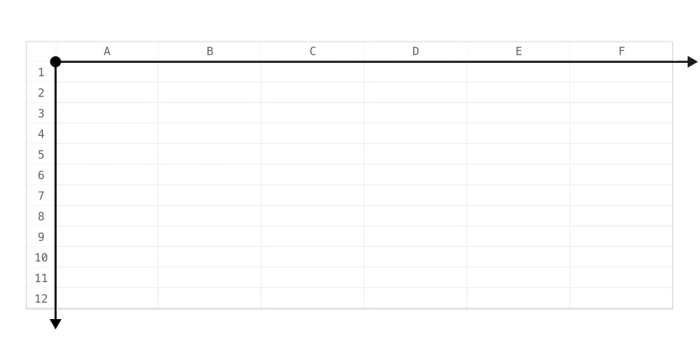
Traditional spreadsheets work on an alphanumeric grid: letters A-Z represent the columns and numbers 1-n represent the rows. The origin of the spreadsheet starts at A1 in the upper left, and it grows incrementally down and to the right.
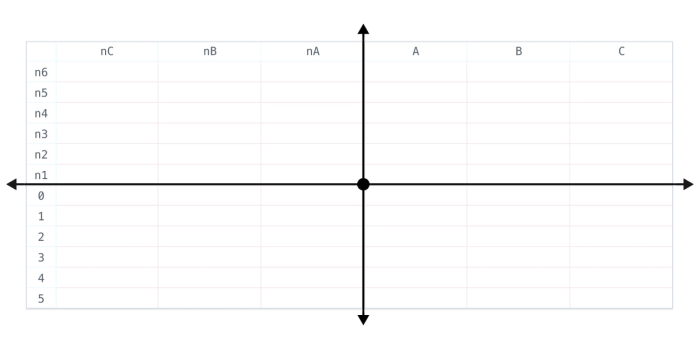
In contrast, as an infinite canvas application, Quadratic works on a coordinate plane where rows and columns are referenced by positive and negative numbers. The origin of the spreadsheet starts at 0,0 and it expands out in all directions infinitely.
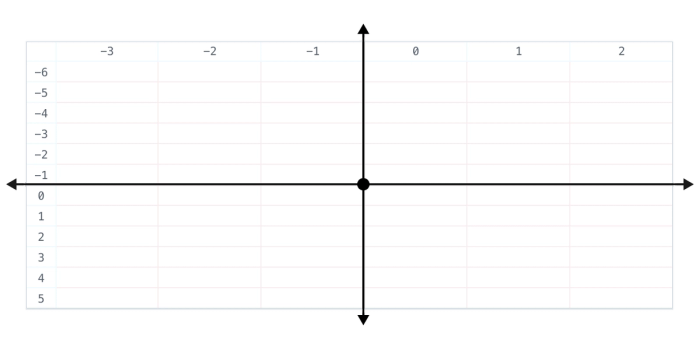
Why 0,0? Because Quadratic is built as a programmable spreadsheet. It leverages the traditional zero-based numbering found in programming languages. This makes interacting with code in the spreadsheet feel intuitive and natural as you reference cells on the grid and cross the origin.
For example, imagine writing some code that sums all values in a column. You start at a specific cell and use a while loop to navigate down the column, reading each new cell value and adding it to the running total.
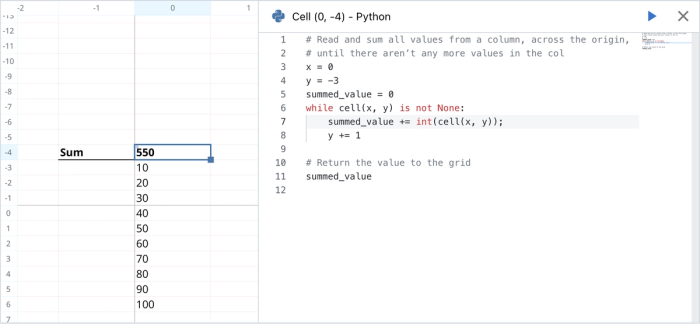
Note how we start at a specific point — (0,-3) — and increment the y value in our cell(x,y) function with each iteration of the loop. Because the infinite spreadsheet uses zero-based numbering, it feels intuitive to use features like for and while loops that iterate across a set of values and naturally cross the spreadsheet’s origin, going from -2 to -1 to 0 to 1 to 2 and on.
The tradeoffs
Zero-based numbering creates an asymmetry across the grid origin, making it difficult to notice the subtle “off-by-one” mismatch between two seemingly symmetrical cell references.
For example, imagine the cells (-2,-2) and (2,2). At first, you might visualize those two cells as mirroring each other’s position across quadrants. However, the cell (2,2) is not the same distance from the origin as (-2,-2)because (2,2) is inclusive of zero.
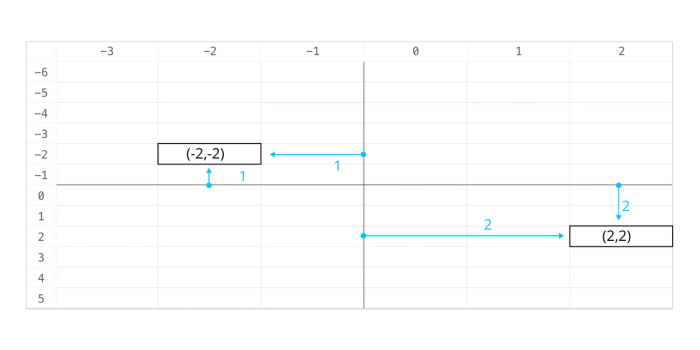
This asymmetry across the origin is a natural consequence of zero-based numbering. Because Quadratic is designed as a programmable spreadsheet, this asymmetry is a feature and necessary trade-off which prevents you from having to write special logic in iterative loops that cross the x- or y-axis.
Spreadsheets use formulas — and A1 notation
While Quadratic is a programmable spreadsheet that allows you to write code in cells, it is also still a spreadsheet which means formulas are a feature — and with formulas comes support for A1 notation, e.g. SUM(A1:A3).
So how do you make a programmable spreadsheet that accommodates two different notations for referencing cells on a grid?
At first, the answer seems simple: change the column labels from 0, 1, 2 to A, B, C and allow “negative characters”, e.g. -C, -B, -A.
In this paradigm, the A column for Formulas is equivalent to the 0 column for Python (while -A is equivalent to -1), which results in a similar asymmetry for cell references across the origin. For example, C2 is two cells right and two cells down from the origin, whereas -C-2 is two cells left and one cell up from the origin.
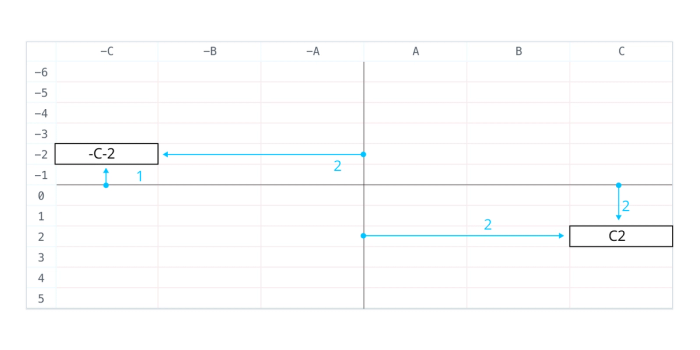
The sheet’s origin also starts at A0 whereas a traditional spreadsheet’s origin is A1. While not ideal, we’ve determined these to be acceptable tradeoffs (for now).
But there’s a problem: negative is also subtract
In Python, - is used to signal a negative value and a subtraction operation. But in Formulas, its usage starts to feel overloaded as both. Take a look at these examples:
| Python | Formula | |
|---|---|---|
| Positive cell reference | cell(2,2) | C2 |
| Negative cell reference | cell(-2,2) | -B-2 |
| Addition operation | cell(2,2)+cell(2,3) | C2+C3 |
| Subtraction operation | cell(-2,-2)-cell(-2,-1) | -B-2--B-1 |
You can see how a classic spreadsheet formula like A1-A2 starts to become confusing for humans to understand and ambiguous for machines to parse — is that an operation, e.g. “A1 minus A2” or a reference to two cells, e.g. “A1 and negative A2”?
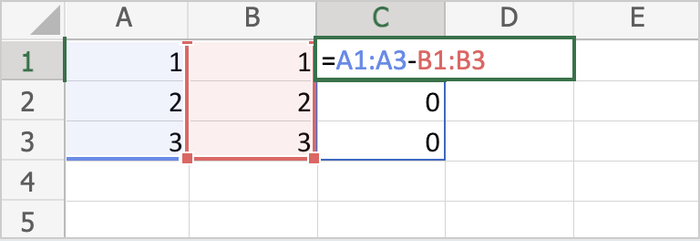
It gets even trickier when you start discussing arithmetic across columns using cell ranges. For example: in Excel, to take column A, subtract values from column B, and put them in column C, you would write something like this in cell C1: A1:A3-B1:B3.
But what if you were working in an infinite canvas spreadsheet and you’re referencing columns whose cell references cross both the x- and y-axis? The resulting formula has a lot of hyphens in it: -A-1:-A1-A-1:A1.
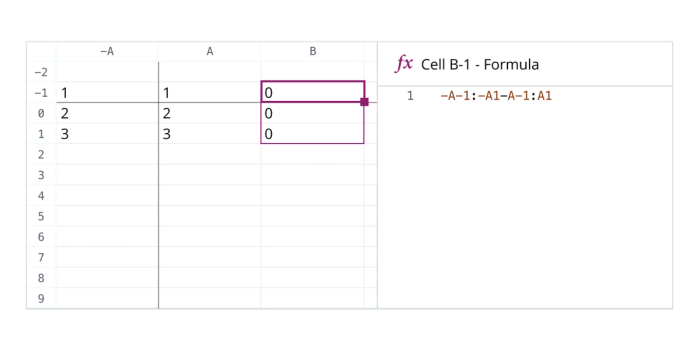
As you can see, overloading - to mean both “negative” and “subtract” becomes confusing as you try to parse and visualize cell references, especially as they cross the x- and y-axis.
Spreadsheets don’t have this problem because they don’t operate on an infinite grid, so we can’t turn to them for inspiration on how to deal with this problem. We have to come up with our own solution.
The grid system in Quadratic
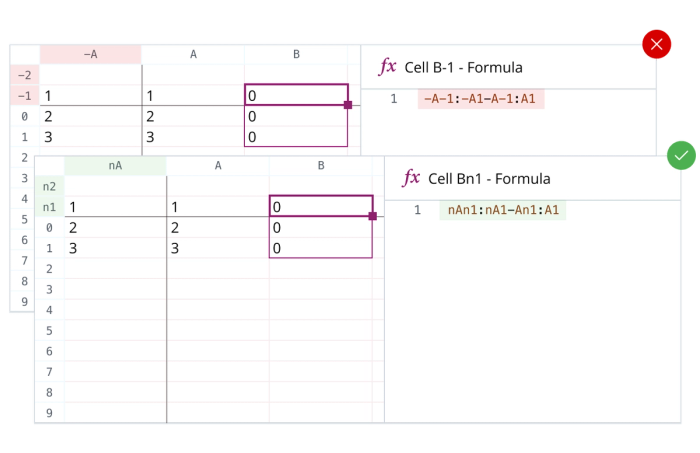
In Quadratic, we’ve come to a solution that leverages the prefix n to represent a negative value on both the x- and y- axis.
This resolves the ambiguity that stems from trying to parse cell references that overload the usage of -. Now negative row and column values are prefixed with n , e.g. nAn1.
Using Quadratic today
By default, sheets in Quadratic use numbers to label rows and columns. When you switch to writing formulas, the row and column headers on the grid change dynamically to match how cells are referenced in formulas.
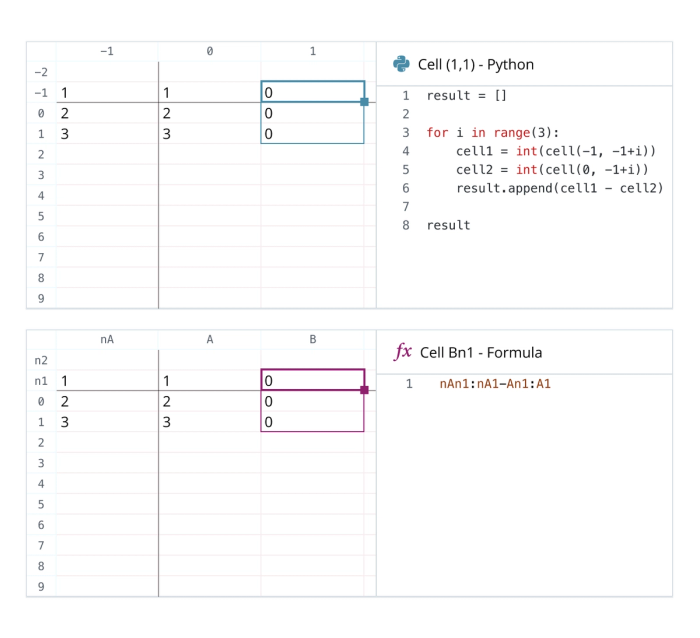
This variable notation allows users to reference cells across the entire infinite canvas in a way that is natural to the context in which they are working: positive and negative integers when writing code, e.g. (-2,-2) and (2,2), and alphanumeric characters when working with formulas, e.g. nBn2 and C2.
Looking to the future
Because Quadratic lies at the intersection of an infinite canvas, a spreadsheet, and an IDE, we’re exploring new ground on how best to merge the underlying concepts of these different paradigms — A1 notation, an infinite coordinate system, zero-based numbering, etc. — into a single, coherent experience that feels natural.
We’re not done refining how this works. Ultimately, we aim to make details like this disappear, so when people use Quadratic they don’t notice the conflicts that arise from fusing different paradigms. We aim to design a solution where people use the app, navigate the infinite canvas, reference cells in Python, use spreadsheet Formulas, and think: “Of course, this is how I would do it. How could it be any other way?”
What we have so far isn’t perfect, but we continue to iterate and explore features like AI agents for spreadsheets. What do you think? How could we improve the UI/X of the coordinate system of an infinite grid? We’re all ears!