
MJ Lindeman, PhD, Community Partner
May 28, 2025

For your datasets, do you struggle with quantitative data analysis and analyzing the effects of multiple factors on your outcomes? The 2-way analysis of variance (ANOVA) is a powerful statistical technique that allows you to examine how two independent variables act and interact to affect a dependent variable. While traditionally complex to implement, AI-powered tools make this advanced analysis accessible to researchers and data scientists of all levels.
For example, you might want to study:
- How both teaching methods and classroom size affect test scores
- How do different drug treatments and delivery methods impact recovery times
- How do different fertilizers and watering schedules affect plant growth
The question about one-way ANOVA vs two-way ANOVA is answered by the number of independent variables. The two-way analysis of variance provides a more complete picture by analyzing:
- The main effect of the first factor
- The main effect of the second factor
- The interaction effect between the factors
A 2-way ANOVA analysis is appropriate when:
- You have one continuous dependent variable (like scores, times, or measurements)
- You have two categorical independent variables (factors)
- Each factor has two or more levels (categories)
- You want to understand both the separate and combined effects of your factors
This post explores how to perform a two-way ANOVA using Quadratic's unique AI spreadsheet analysis environment. We will cover everything from the statistical foundations to practical implementation, assumption checking, and result interpretation.
Understanding two-way ANOVA: The basics
The Quadratic AI spreadsheet's two-way ANOVA in Python examines the influence of two categorical independent variables (factors) on a continuous dependent variable. There are three types of normal two-way ANOVAS available in Python libraries, and experts who want to just change the code can set the value of the Python “typ” variable to 1, 2, or 3 for Type I, II, or III.
The three types use different methods to calculate the Sum of Squares (SS). These methods matter because they determine how variance is partitioned among effects, particularly with unbalanced designs (unequal group sizes).
- Type I (Sequential) tests each effect in order, adjusting only for preceding effects, which means results depend on variable order.
- Type II adjusts main effects for other main effects but not interactions, making it suitable when interactions are expected to be negligible.
- Type III, the most commonly used, adjusts each effect for all other effects, including interactions, which provides the "unique" contribution of each factor.
While the differences between these types are most pronounced with unbalanced designs, they can still matter even with balanced data. In balanced designs without interactions, Types I and II produce identical results. Type III may differ when interaction terms are present because it adjusts the main effects for these interactions.
Most statistical software defaults to Type III SS because it provides the most conservative and consistent results across different model specifications, making it the standard choice for scientific research. It answers three key questions:
- Is there a main effect of the first factor?
- Is there a main effect of the second factor?
- Is there an interaction effect between the two factors?
For example, during research and data analysis, a researcher might investigate how both fertilizer type (Factor A) and watering frequency (Factor B) affect plant growth (dependent variable). Two-way ANOVA analysis can reveal whether each factor independently affects growth and whether their combination produces unique effects that cannot be predicted from either factor alone.
This approach provides four key advantages for your data analytics strategy because it:
- Examines multiple factors simultaneously, reducing the need for separate tests
- Reveals interaction effects that might be missed by simpler analyses
- Increases statistical power by accounting for more sources of variation
- Provides a more comprehensive understanding of complex relationships
Implementing two-way ANOVA in Quadratic
Quadratic AI combines the accessibility of a spreadsheet with the intelligence of an embedded AI natural-language interface. This makes it ideal for performing 2-way ANOVAs in Python. Let's walk through the process using a concrete 2-way ANOVA example.
Step 1: Prepare your data
The Quadratic AI spreadsheet formatting functionality is simple yet powerful, allowing you to quickly organize your experimental design. You can even paste in data as text and prompt the AI to convert your input to a numeric data table.
Data is normally input as three columns:
- Column A: The dependent variable (measurement)
- Column B: Factor A (first categorical variable)
- Column C: Factor B (second categorical variable)
For example:
| Score | Teaching Method | Classroom Size |
|---|---|---|
| 85 | Method A | Small |
| 90 | Method A | Small |
| 75 | Method A | Large |
| 76 | Method A | Large |
| 83 | Method B | Small |
| 80 | Method B | Small |
| 89 | Method B | Large |
| 93 | Method B | Large |
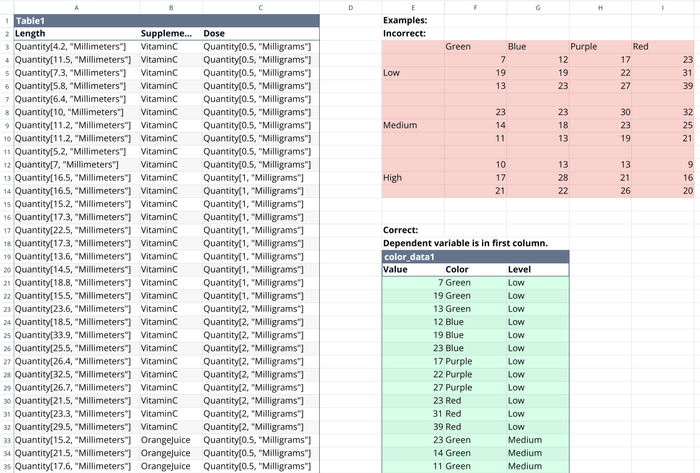
Quadratic’s AI can also interpret a data table that has the dependent variable as the cell values in a matrix with, for example, three values of one independent variable labels in the columns and the appropriate label for the other independent variable in each row. If a data conversion is necessary, the AI will rewrite the data to show the values it is analyzing as its data. It is important to verify that the data being analyzed is the data that you intend to analyze.
Step 2: Run the two-way ANOVA analysis
Unlike traditional methods that require complex programming, Quadratic's AI assistant can perform a two-way ANOVA calculator function with natural language instructions. You can ask the AI to run a two-way ANOVA on your selected data, and it will:
- Read your data from the specified cells
- Perform the ANOVA calculations
- Generate appropriate visualizations
- Suggest post-hoc tests when needed
Type a clear prompt like: "Run a two-way type II ANOVA on this data using column A as my dependent variable, column B as my first factor, and column C as my second factor. Please check assumptions and include visualizations." This effectively gives you an ANOVA analysis calculator in your spreadsheet.
You can be more specific with requests like:
- "Please also perform a Type III two-way ANOVA analysis."
- "Include post-hoc tests for significant effects."
- "Create an interaction plot for the relationship between factors."
- "Generate box plots for each group to visualize the distribution."
- "Create a main effects plot for each factor."
Step 3: Check the ANOVA assumptions
Before interpreting your results, it is crucial to verify that your data meets the assumptions of a 2-way ANOVA test calculator. Ask Quadratic's AI to check:
- Normality of residuals: Are the errors normally distributed?
- Homogeneity of variances: Is the variance similar across all groups?
- Independence: Are observations independent of each other?
- Absence of outliers: Are there extreme values distorting the results?
There is no need for a separate 2-way ANOVA table calculator because you can also ask the AI specifically to check assumptions. For example: "Check the ANOVA assumptions for this data and tell me if any are violated. If so, suggest appropriate alternatives."
If you encounter problems, ask the AI for help:
- "My data shows non-normality. What transformation would you recommend?"
- "How should I handle the outliers identified in group A?"
- "Can you suggest a non-parametric alternative for this analysis?"
The beauty of Quadratic's AI integration is that you can have a conversational approach to your analysis. You can ask follow-up questions, request clarification, or explore different analytical approaches, and you can get results in your browser without needing to write code or remember specific statistical formulas.
Step 4: Interpret the results
The AI's ANOVA output can provide several key pieces of information on first pass or when prompted to do so:
- ANOVA Table: Shows F-statistics and p-values for each factor and their interaction
- Effect Sizes: Values indicating the magnitude of each effect
- Descriptive Statistics: Means, standard deviations, and sample sizes for each group
- Visualizations: Interaction plots, main effect plots, and box plots
- Post-hoc Tests: Pairwise comparisons when significant effects are found
- Automated Interpretation: Plain-language explanation of the statistical findings
For example, you can use AI prompts for summarizing reports to get help interpreting complex results:
- "Explain the interaction effect in plain language."
- "What does the significant main effect of Factor A mean in practical terms?"
- "How should I interpret these results in the context of my research question?"
Special cases: Other two-way ANOVA models
Depending on your experimental design, you might need to use variations of the standard two-way ANOVA. For specific ANOVA variants, just ask:
- "Run a two-way ANOVA without replication since I only have one observation per group."
- "Perform a repeated measures ANOVA as the same subjects were tested in all conditions."
- "This is an unbalanced design, so please use Type III sum of squares."
With or without replication
Two-way ANOVA with replication means testing multiple samples under each combination of your factors. For example, testing five plants in each fertilizer-sunlight combination. This common approach lets you detect interaction effects and provides more reliable results.
Two-way ANOVA without replication means testing just one sample per factor combination (one plant per fertilizer-sunlight combination). This simpler design saves resources but cannot detect interaction effects between your factors and provides less statistical power.
Repeated measures
Two-way ANOVA with repeated measures tests the same subjects across different conditions. Instead of different plants for each condition, you measure the same plants under all combinations of factors. This approach controls for individual differences but requires additional statistical assumptions.
Mixed designs combine both approaches: one factor varies between different groups (e.g., different plant species), while the other factor is tested across the same subjects (e.g., each plant species tested under multiple light conditions). This offers a practical compromise when full repeated measures aren't possible.
Case study: Analyzing the ToothGrowth dataset
To demonstrate, let's apply a two-way ANOVA to the ToothGrowth dataset, which examines how supplement type and dosage affect guinea pig tooth growth. This is the example in the Quadratic AI two way ANOVA calculator template. A detailed explanation is in section 4.4 of Greenwood’s Intermediate Statistics with R.
Step 1: Import and prepare the data
After importing the ToothGrowth dataset into Quadratic, we organize it with:
- Column A: Tooth length (dependent variable)
- Column B: Supplement type (OJ or VC)
- Column C: Dose (0.5, 1.0, or 2.0 mg/day)
Because the data is text, the AI needs to convert it to numbers before doing the analysis. This can be done by either asking the AI to do it or by using the spreadsheet’s menu options.
Step 2: Run the two-way ANOVA
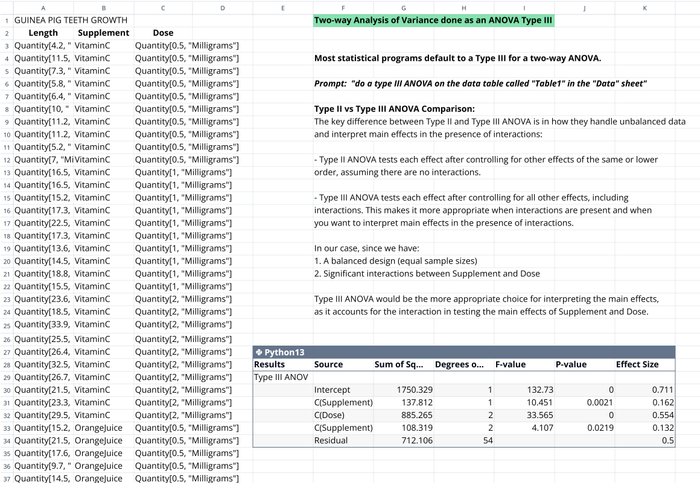
Using Quadratic's AI assistant, we can simply ask it to perform a two-way Type III ANOVA on our data, which generates a complete analysis.
Step 3: Check assumptions
When you ask the AI to check assumptions, it runs the Shapiro-Wilk test for whether residuals are normally distributed and Levene’s test for whether variances are homogeneous. Also, ask it to check whether there are any outliers in the dataset. If the assumptions are met, then you can confidently interpret the ANOVA results.
The values for Levene’s test in this example show why converting textual data to numbers is crucial. When the dataset was not converted to numbers, the p-value was 0.058. In contrast, extracting the numbers from the text strings (which included unit names) yielded a p-value of 0.148.
Step 4: Interpret results
You can ask the AI to show the “Statistical Results Interpretation,” and you can ask it to explain the results in simple language.
Step 5: Post-hoc analysis
The AI normally suggests post-hoc analyses to consider, and if it does not, you can ask for them. The beauty of Quadratic is that the AI handles the mathematical complexity while you focus on interpretation.
Conclusion: Unlocking insights with two-way ANOVA
Two-way ANOVA is a powerful analytical technique that can reveal complex relationships in your data that might otherwise remain hidden. By implementing ANOVA analysis in Python through Quadratic's AI-powered spreadsheet environment, you gain:
- Statistical rigor: Comprehensive analysis that meets academic standards
- Visual clarity: Automatic generation of publication-quality visualizations
- Practical guidance: Automated interpretation and assumption checking
- Flexible alternatives: Clear pathways when your data violates assumptions
- Accessible power: Complex statistical analysis without writing extensive code or needing an Excel formula explainer
Mastering the two-way ANOVA expands your analytical toolkit of data analytics techniques and deepens your understanding of multifaceted relationships in your data. This is true whether you're a researcher investigating experimental results, a business analyst exploring customer behavior, or a data scientist building predictive models.
Ready to try it yourself? Quadratic makes this powerful analysis accessible to everyone. There is no need for a separate ANOVA Excel template. Simply open a new Quadratic spreadsheet, enter your data, and use the AI assistant to uncover the complex interactions hiding in your datasets.
The combination of traditional spreadsheet accessibility with powerful AI makes Quadratic the ideal environment for both statistical novices and experts alike. Start exploring the interactions in your data today by doing a two-way ANOVA in Quadratic.