Master statistical analysis with our comprehensive five number summary calculator template. This powerful spreadsheet demonstrates how to calculate five number summary statistics across diverse datasets, making complex statistical concepts accessible through practical, real-world examples.
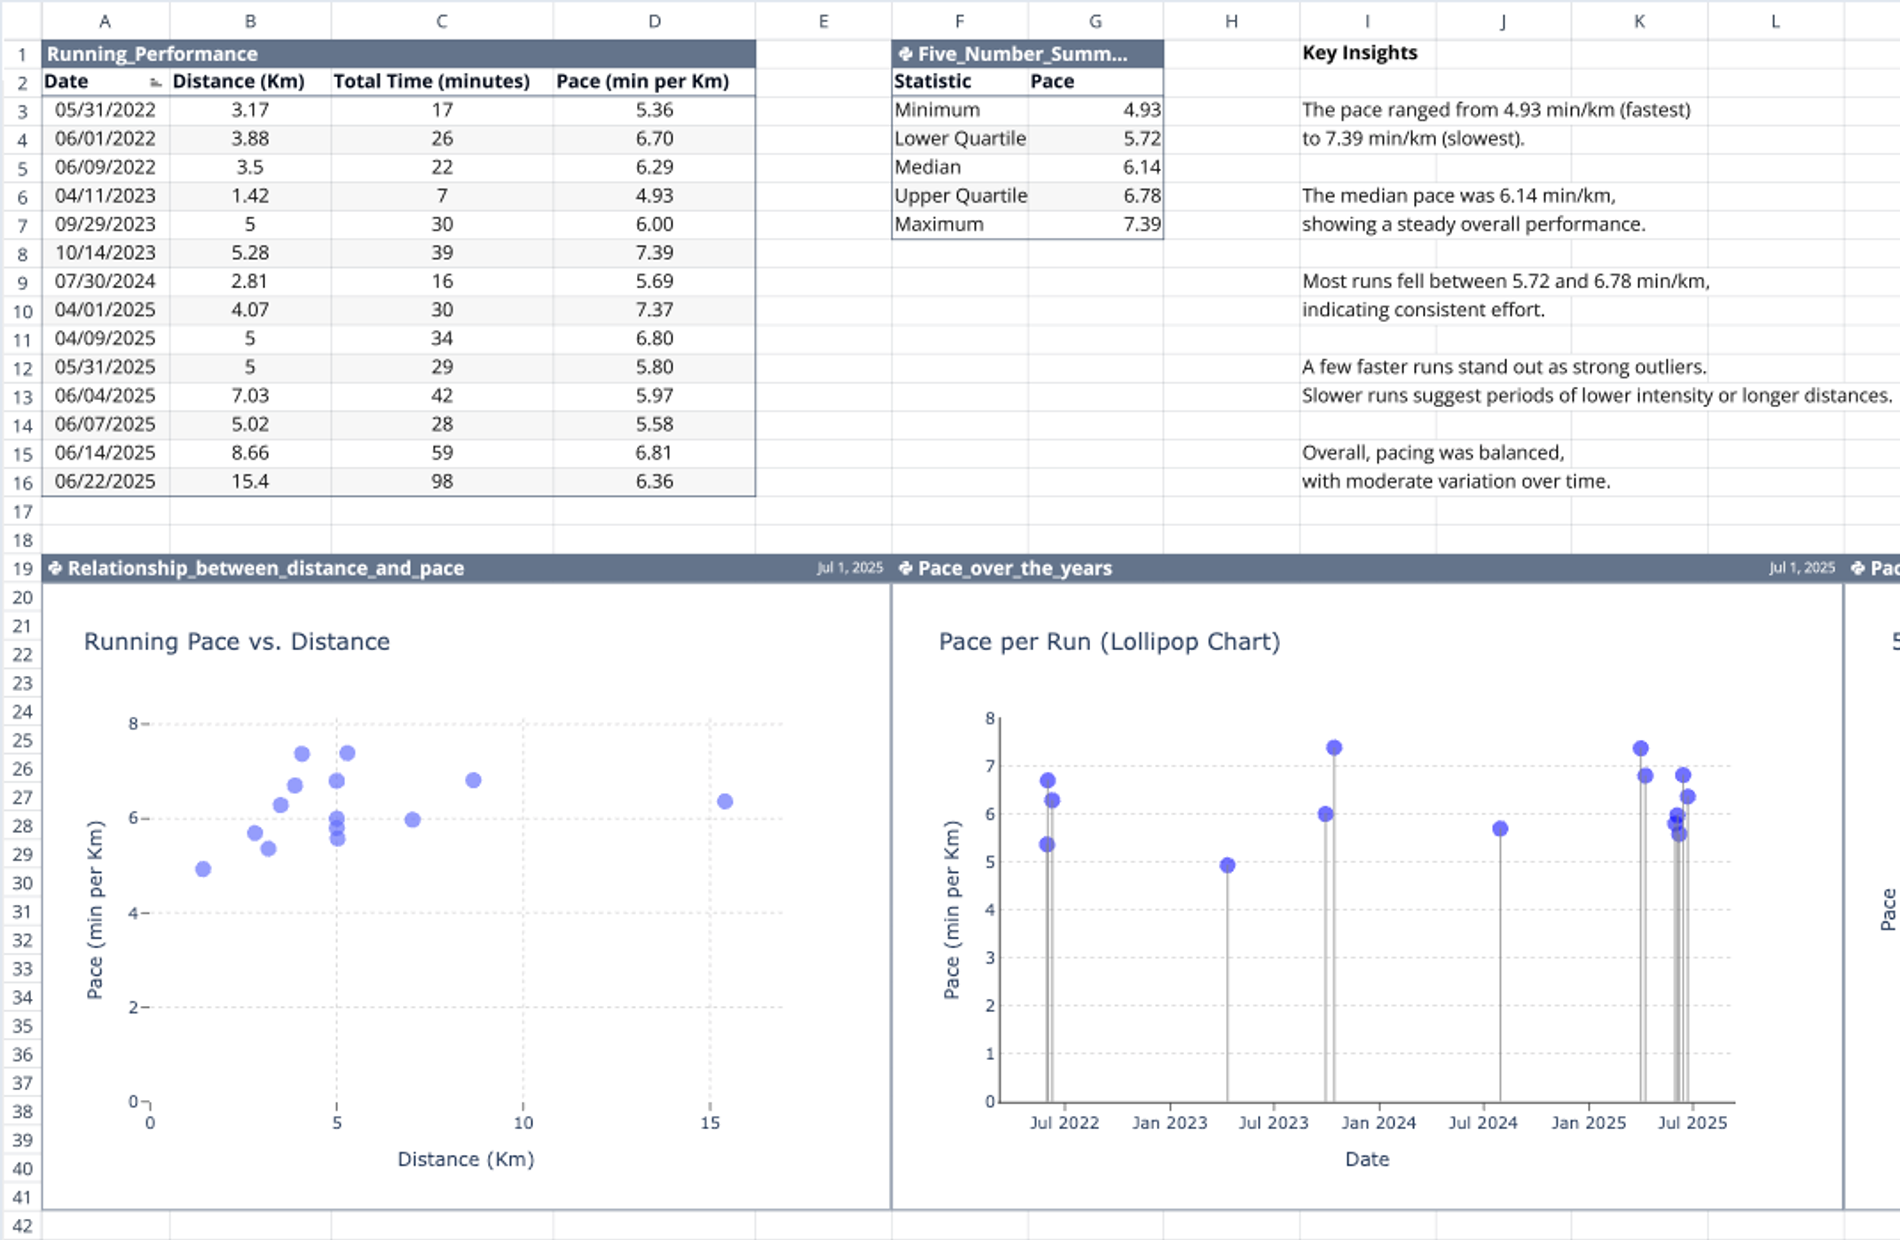
This template serves as your complete guide to 5 number summary calculator functionality, featuring three distinct examples: employee salaries, house prices, and running performance data. Each example demonstrates different applications of five number summary analysis, from HR analytics to real estate market research and personal fitness tracking. The integrated visualizations transform raw statistics into compelling 5 number summary box plot calculator displays that reveal data patterns instantly.
How users interact
- Step 1: Choose from three pre-built examples or replace sample data with your own dataset in the structured tables.
- Step 2: The template automatically calculates minimum, first quartile (Q1), median, second quartile (Q3), and maximum values using built-in statistical functions.
- Step 3: Review the automated box plot visualizations that serve as an interactive find the 5 number summary calculator tool, displaying statistical distributions clearly.
- Step 4: Analyze the generated insights using the professional summary tables that organize results by categories or time periods.
Best practices: Ensure data consistency within each dataset, understand your data context before analysis, and use the visual outputs to identify outliers or unusual patterns. The template's automated approach shows you exactly how to calculate five number summary statistics without complex manual formulas.
Who it's for
Data Analysts use this template for exploratory data analysis and statistical reporting. Researchers apply it to summarize experimental results and survey data. Business Professionals leverage it for market analysis, performance metrics, and quality control assessments.
Real-world applications span multiple industries: financial analysts examining investment returns, healthcare professionals analyzing patient metrics, educators assessing test scores, and sports analysts evaluating performance data. The template's versatility makes it valuable for anyone needing to calculate five number summary statistics professionally.
Key highlights & differentiators
This template eliminates the complexity typically associated with statistical analysis. The automated 5 number summary calculator functionality handles all mathematical computations, while integrated box plots provide immediate visual interpretation. Unlike basic calculators, this comprehensive tool combines data organization, statistical calculation, and professional visualization in one seamless workflow.
The multi-example approach demonstrates statistical concepts across different data types, helping users understand when and how to apply five number summary analysis effectively.
Ready to master statistical analysis?
Transform your data analysis capabilities with this comprehensive five number summary template. Whether you're analyzing business metrics, research data, or personal tracking information, this tool provides the foundation for professional statistical insights.
Duplicate the template now and discover how easy statistical analysis can be with the right tools.