Transform your measurement analysis with our comprehensive Relative Error Calculator template. This intuitive spreadsheet helps you quickly calculate, visualize, and understand both absolute and relative errors in your measurements, making it an essential tool for quality control, scientific research, and educational purposes.
Perfect for:
- Scientists and researchers validating experimental results
- Quality control engineers monitoring manufacturing precision
- Students learning about measurement accuracy
- Teachers demonstrating error analysis concepts
- Lab technicians verifying instrument calibration
Key features:
1. Instant error calculations
- Automatically computes absolute error from measured and actual values
- Calculates relative percent error for precision analysis
- Real-time updates as you input new measurements
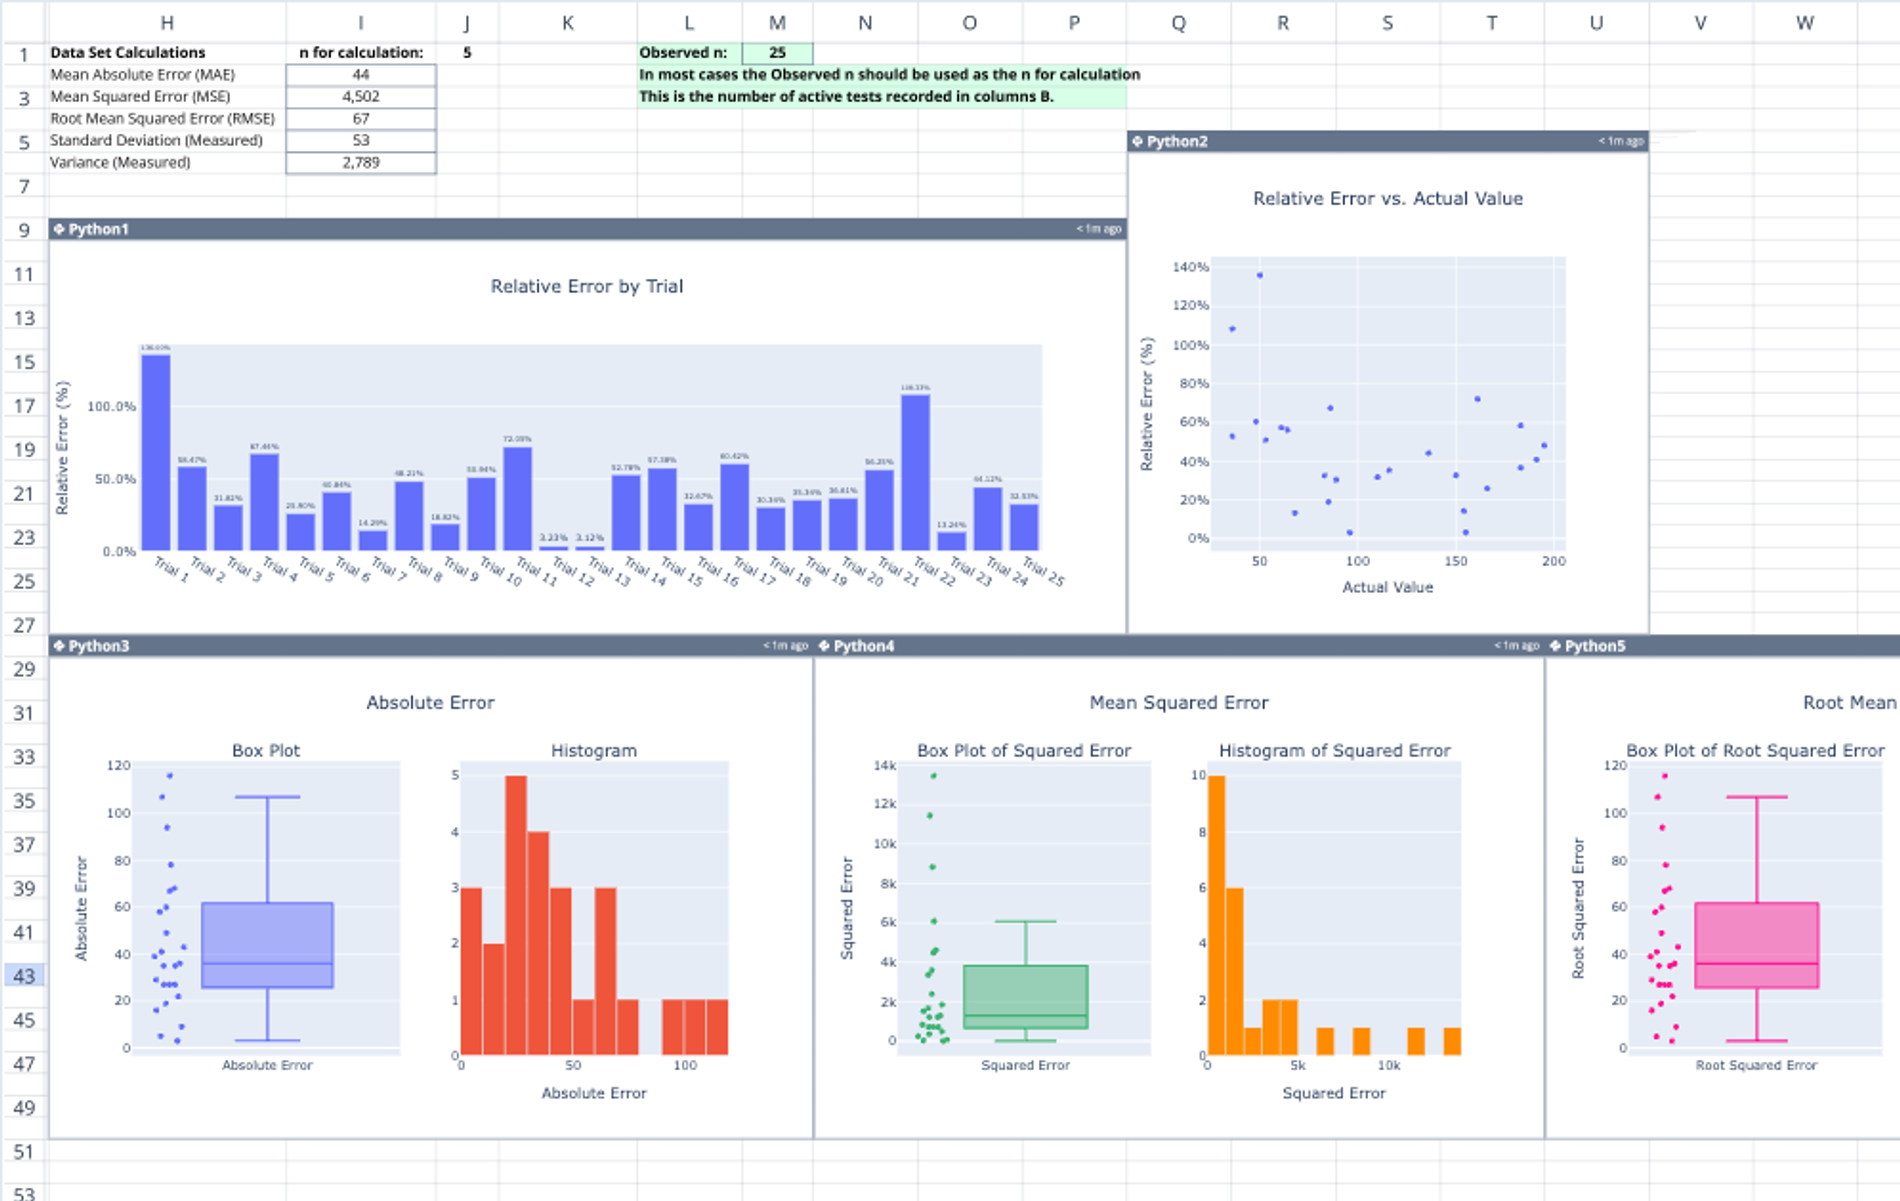
2. Visual analytics dashboard
- Interactive bar charts showing relative error distribution
- Scatter plots revealing error patterns across measurements
- Box plots and histograms for statistical analysis
- Clear visualization of error trends and outliers
3. Professional reporting
- Clean, organized layout for easy data entry
- Ready-to-present visualizations
- Comprehensive error analysis in one view
How to calculate relative error:
- Enter your measured and actual values in the designated input cells
- Watch as calculations update automatically
- Review the generated visualizations for insights
- Use the analysis to make informed decisions about measurement accuracy
What sets this template apart
Unlike basic relative error calculators, this template provides a complete analytical environment. It combines the simplicity of a spreadsheet with powerful Python-driven visualizations, giving you both numerical precision and intuitive visual understanding of your measurement accuracy.
Best practices:
- Input data consistently for meaningful comparisons
- Use the visualizations to identify systematic errors
- Reference both absolute and relative errors for comprehensive analysis
- Export charts for documentation or presentations
Whether you're calculating relative error for a single measurement or analyzing patterns across multiple trials, this template streamlines your workflow while providing deep insights into measurement precision.
Ready to elevate your error analysis? Try our Relative Error Calculator template today and experience the perfect blend of simplicity and analytical power in Quadratic.