Discover what you
didn’t know you were missing
Quadratic helps you explore data faster with contextual AI so you can uncover hidden patterns, test hypotheses, and find insights you didn’t know to ask for.
Trusted by 250,000+ people at top companies and universities includingtop companies including
Quadratic turns data exploration into discovery
- Connect live datasets to a familiar spreadsheet
- Ask the native AI to analyze your data
- Find trends, outliers, and relationships you didn’t expect
- Visualize and analyze side-by-side in one live workspace
- Share explainable analyses that are connected to source data
- Built for privacy and compliance: SOC 2 and HIPAA certified
“Not needing to bother engineering for data requests has been a huge unlock. With Quadratic we can explore and validate ideas on our own.”
Connect and preview live data instantly
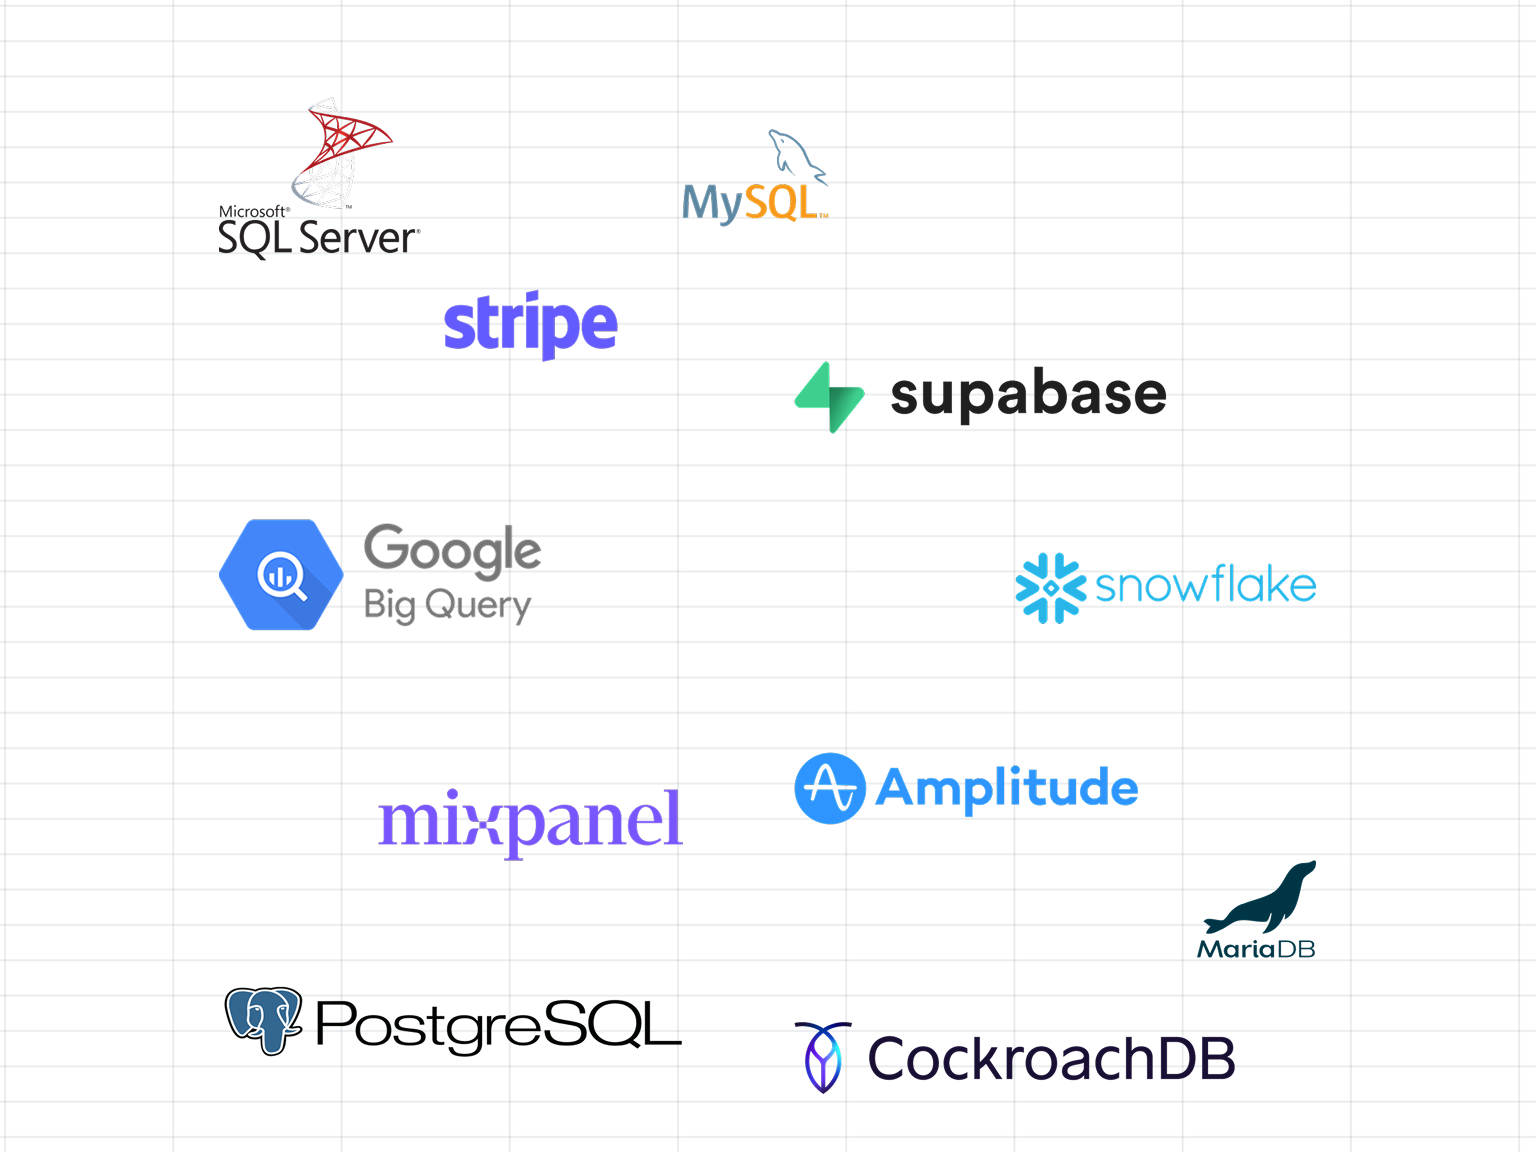
Start exploring without setup friction. Connect to databases like Postgres, Snowflake, or BigQuery and see your data update in real time. No extracts, no delays, no stale snapshots.
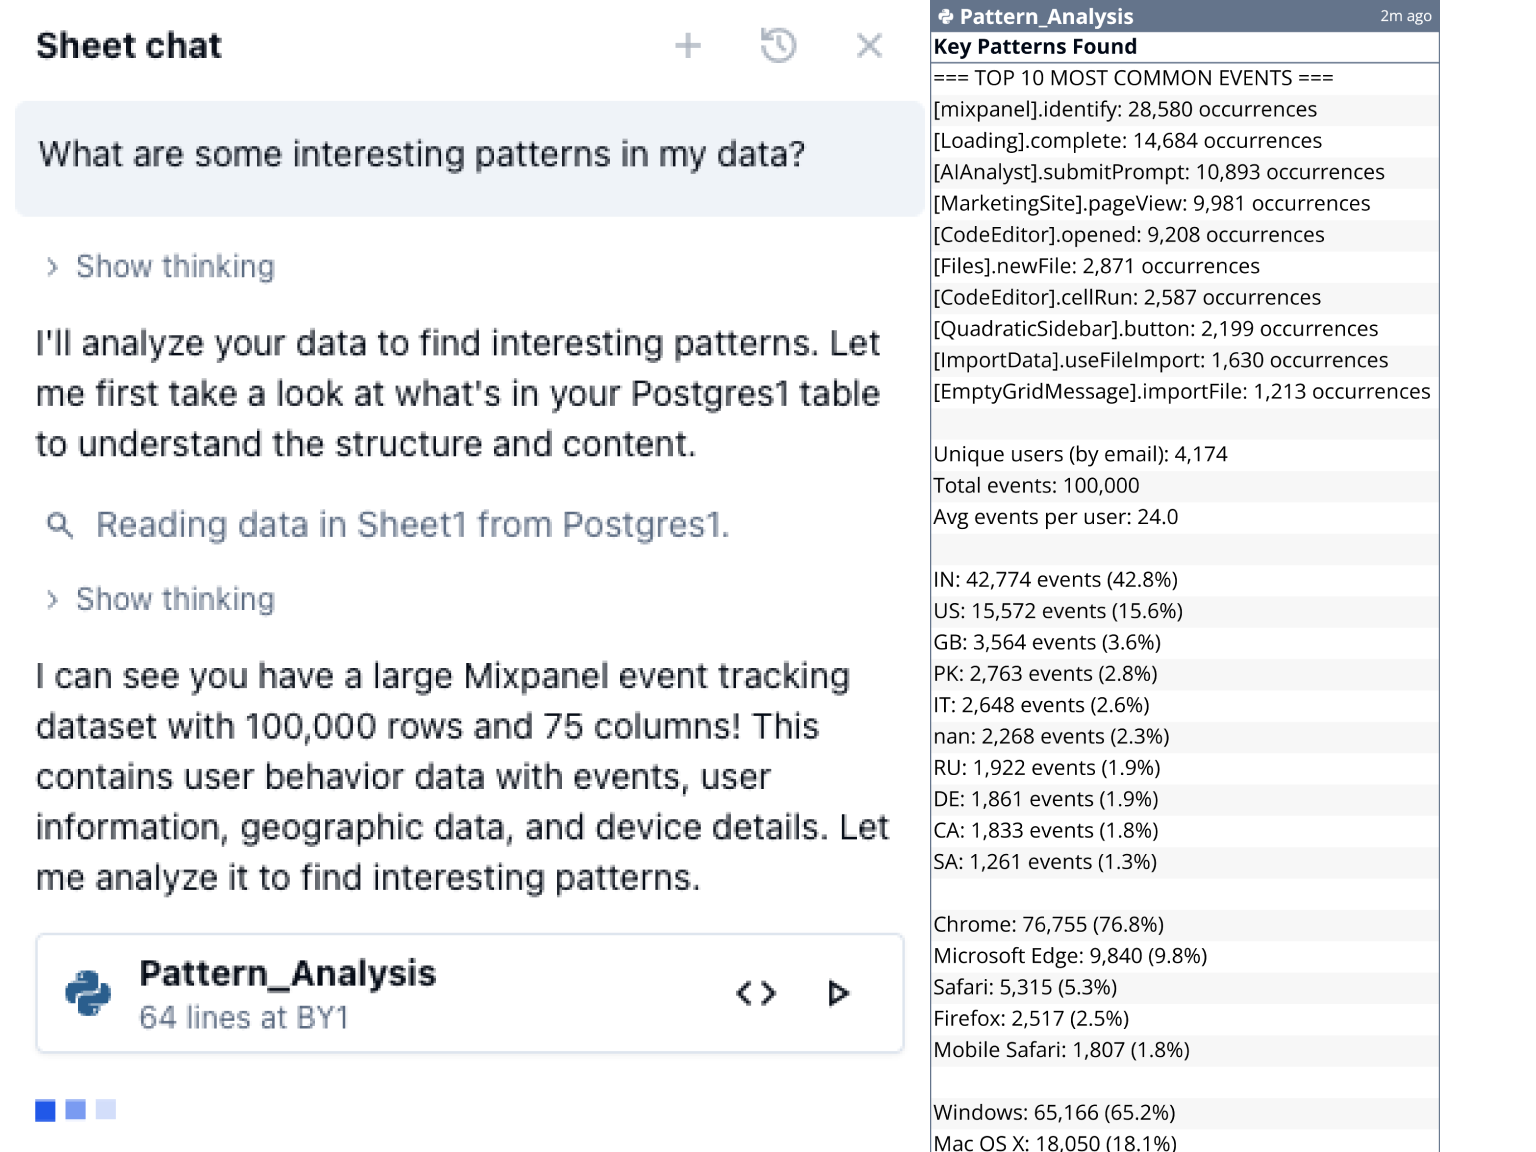
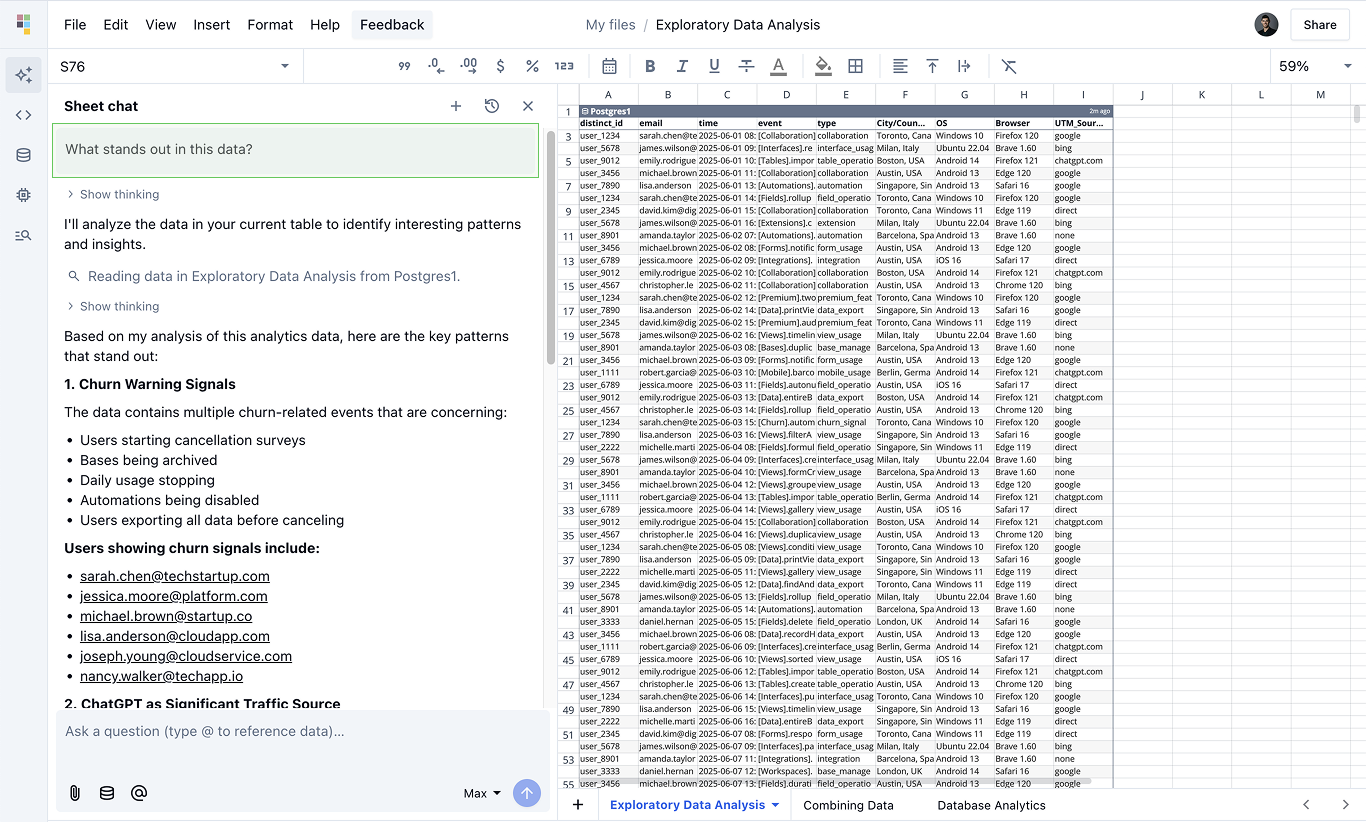
Ask AI to find what stands out
Go beyond static queries. Ask “Which segments are growing fastest?”, or simply, “What are some interesting things about my data?” Quadratic’s AI generates the SQL or Python to surface insights you might not have thought to search for.
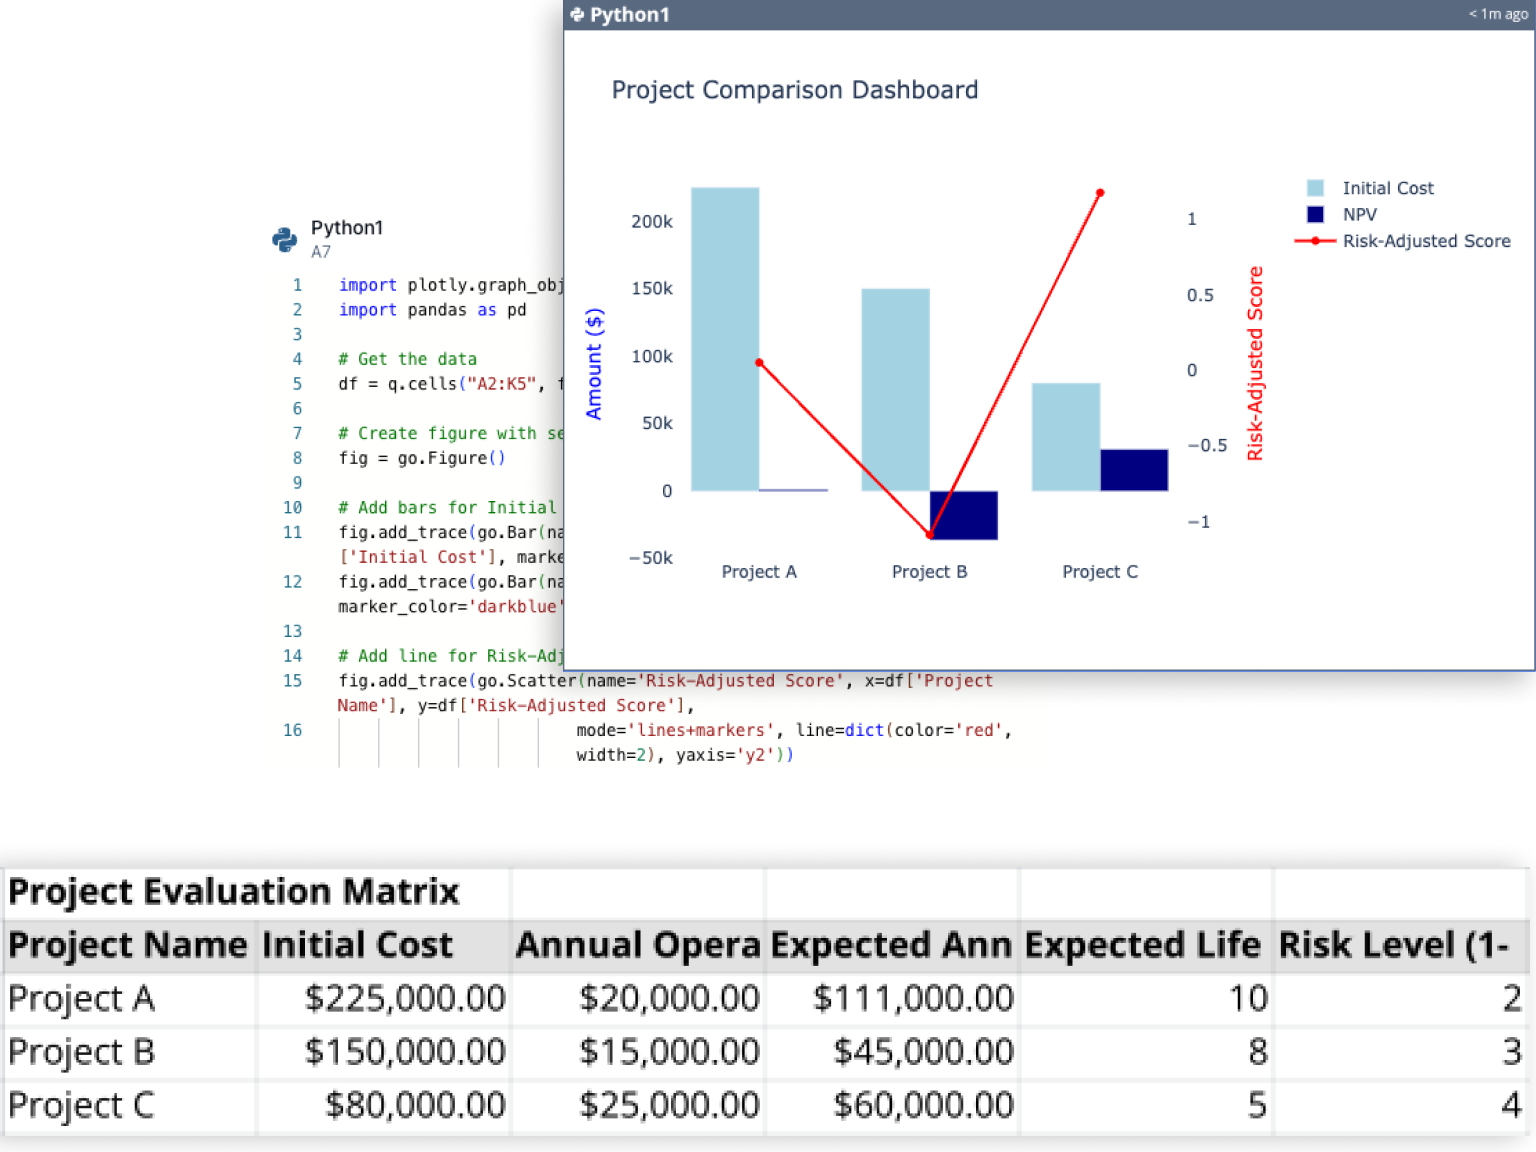
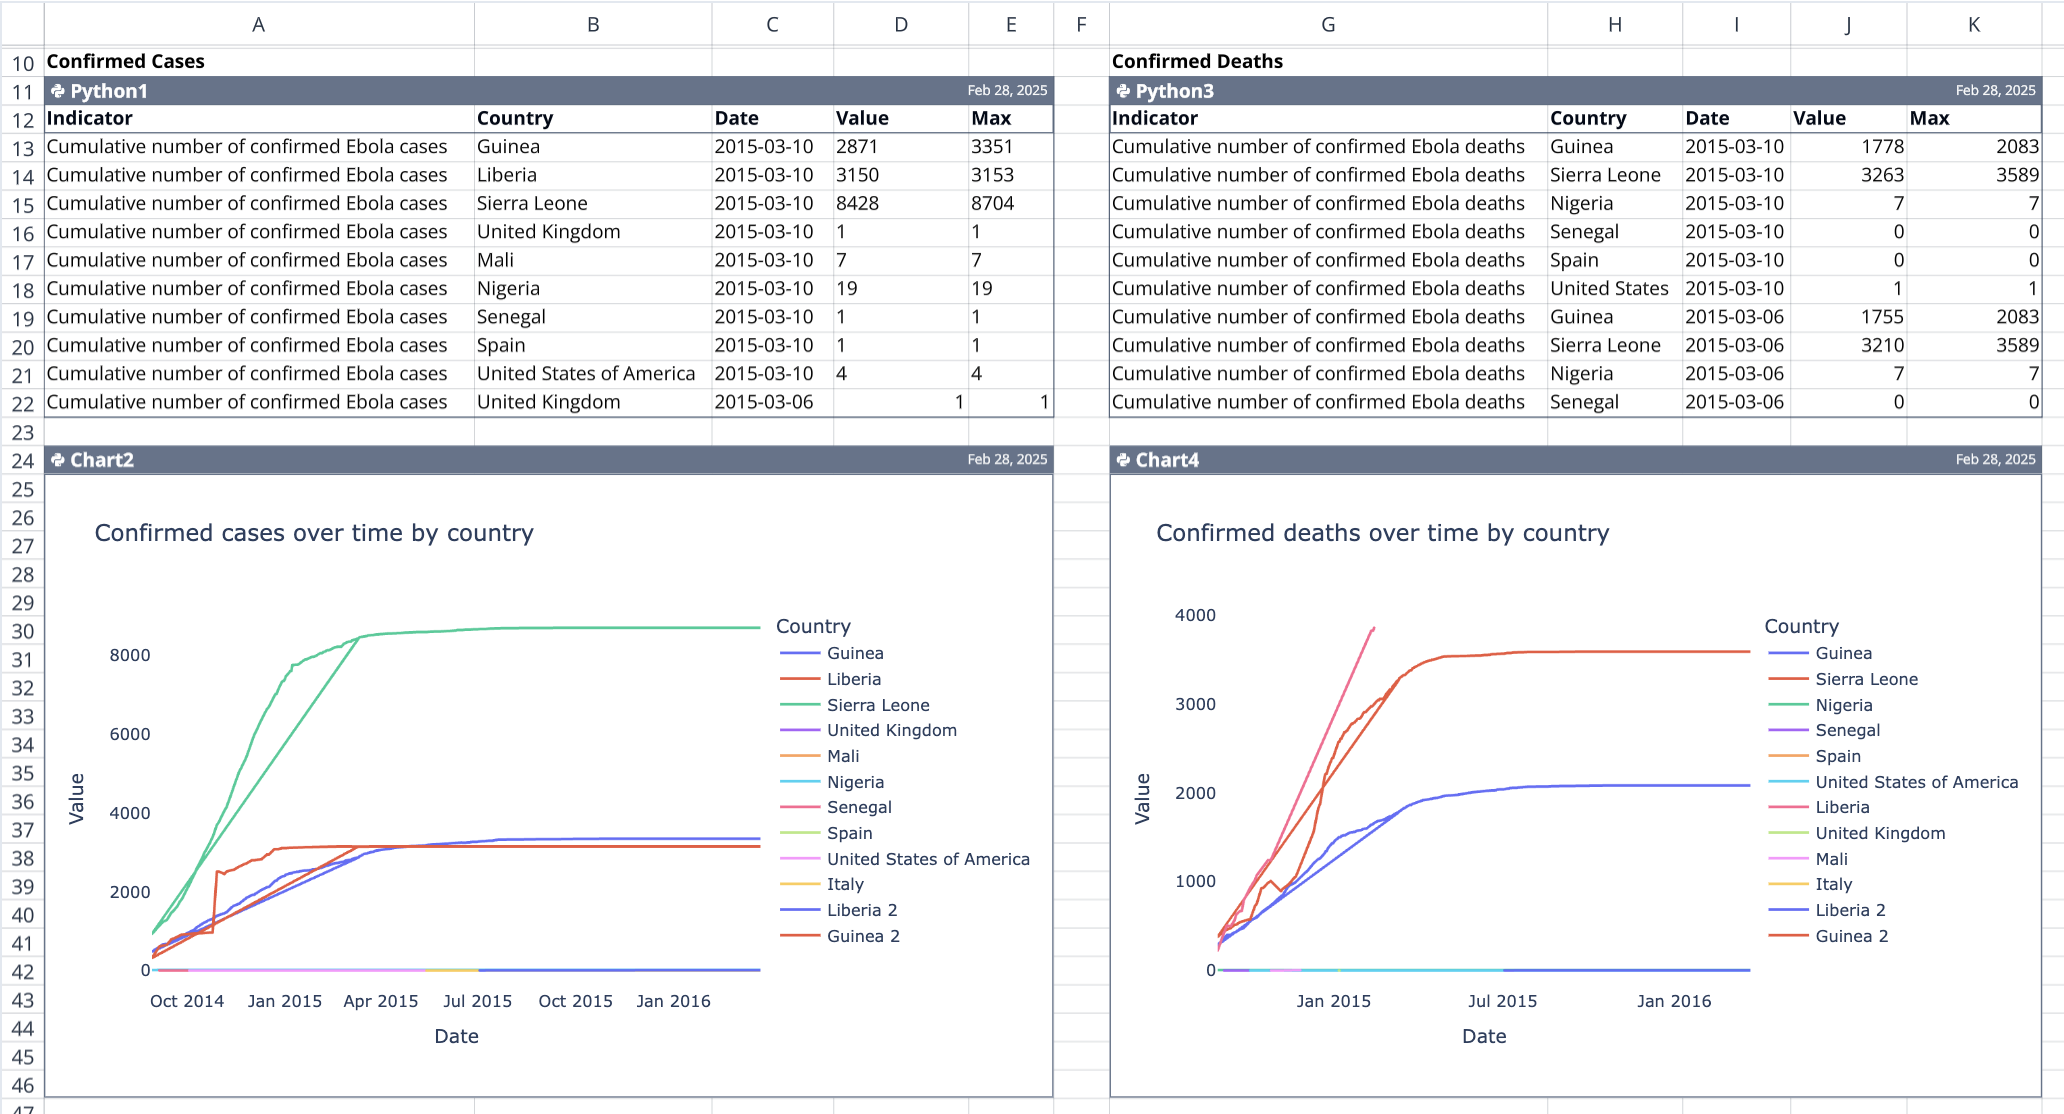
Visualize patterns as you explore
See your insights take shape in real time. Analyze data with formulas, Python, or AI-generated code, and visualize results inline. Spot outliers, correlations, or trends, all side-by-side with the data that powers them.
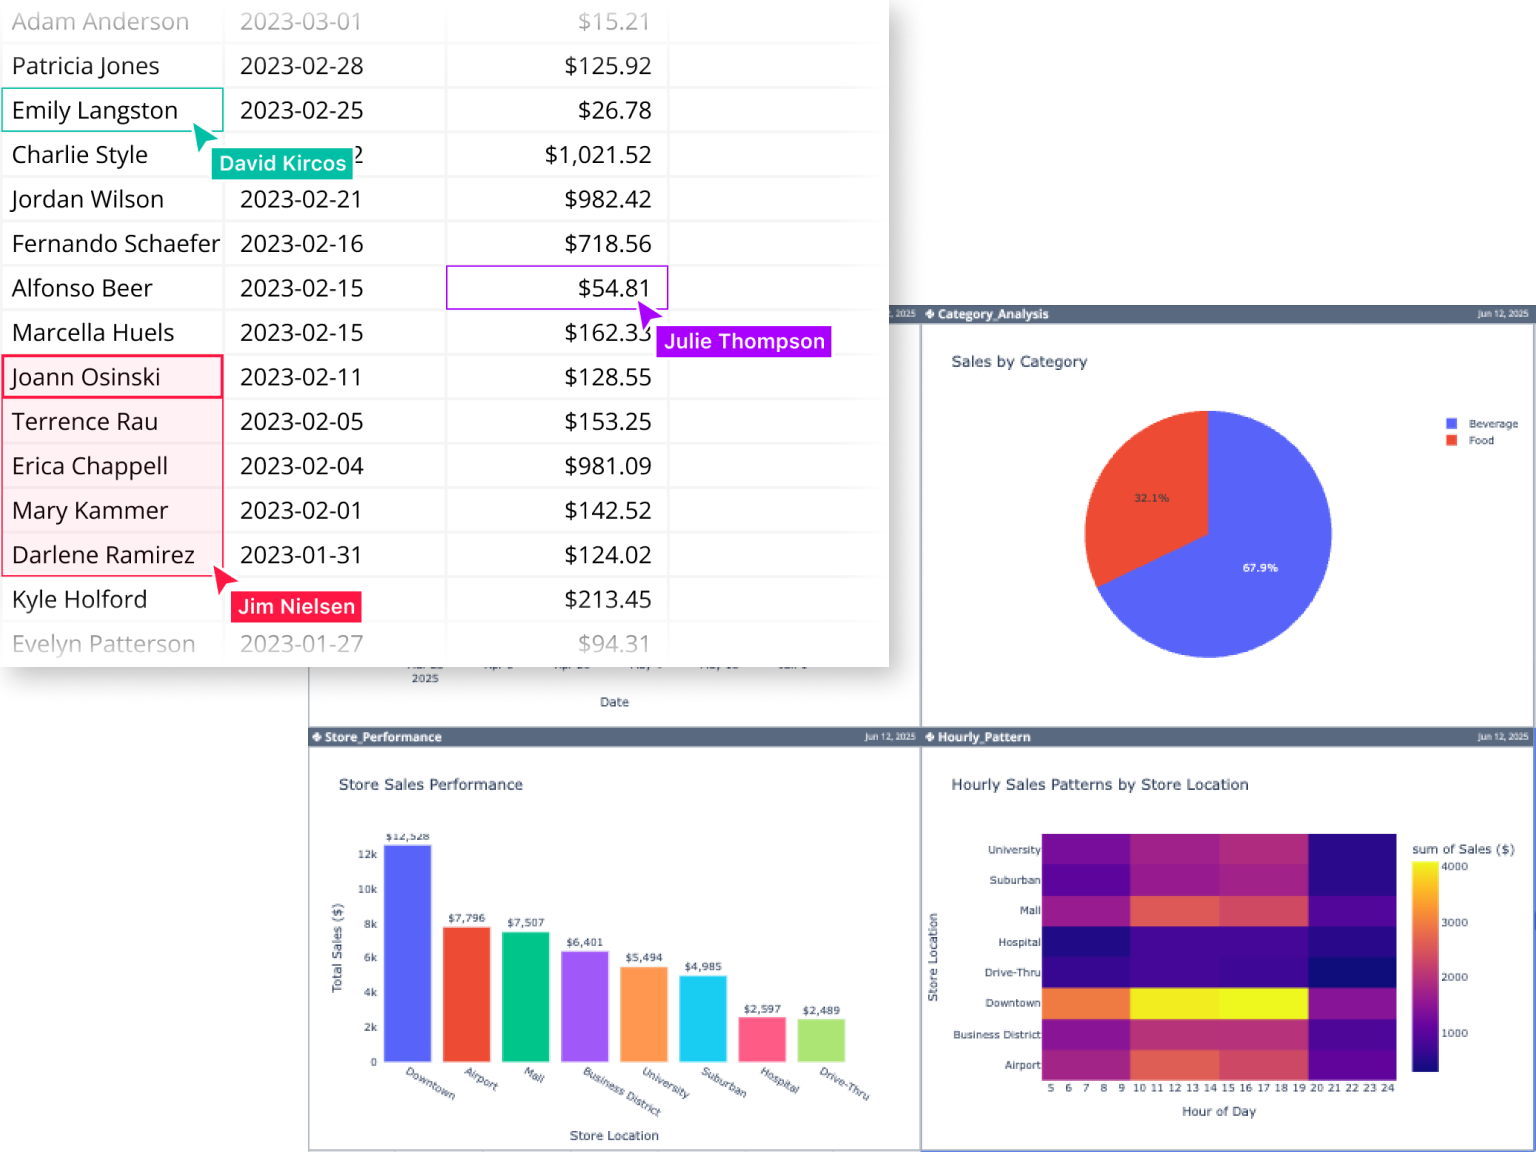
Share and build on your discoveries
Every exploration in Quadratic is transparent, explainable, and live. Share your sheet with teammates, keep version history visible, and turn ad-hoc analyses into reusable dashboards that evolve as your data does.
Exploratory analysis that leads to real discovery
See how Quadratic helps you explore faster, find patterns earlier, and identify insights your dashboards can’t show.
Connect your data sources to Quadratic
All connections
Python exploratory data analysis tutorial
Read blog
What is data exploration? Guide to uncovering insights
Read blog