Unify your data.
Simplify your analysis.
Combine data from databases, SaaS tools, spreadsheets, and APIs in one AI-powered workspace so your team can see the full picture and act faster.
Trusted by 250,000+ people at top companies and universities includingtop companies including
Quadratic is the fastest way to combine and analyze your data
- Connect live databases, CSVs, and APIs in one place
- AI that helps you clean, join, and transform datasets
- Unified workspace for SQL, Python, and spreadsheet logic
- Version history for transparent, reproducible workflows
- Real-time dashboards that refresh automatically
- SOC 2 & HIPAA compliance for enterprise-grade security
“Quadratic completely changed how we run experiments. I can explore test data, validate results, and share insights in minutes, all without waiting on a dashboard or SQL review.”
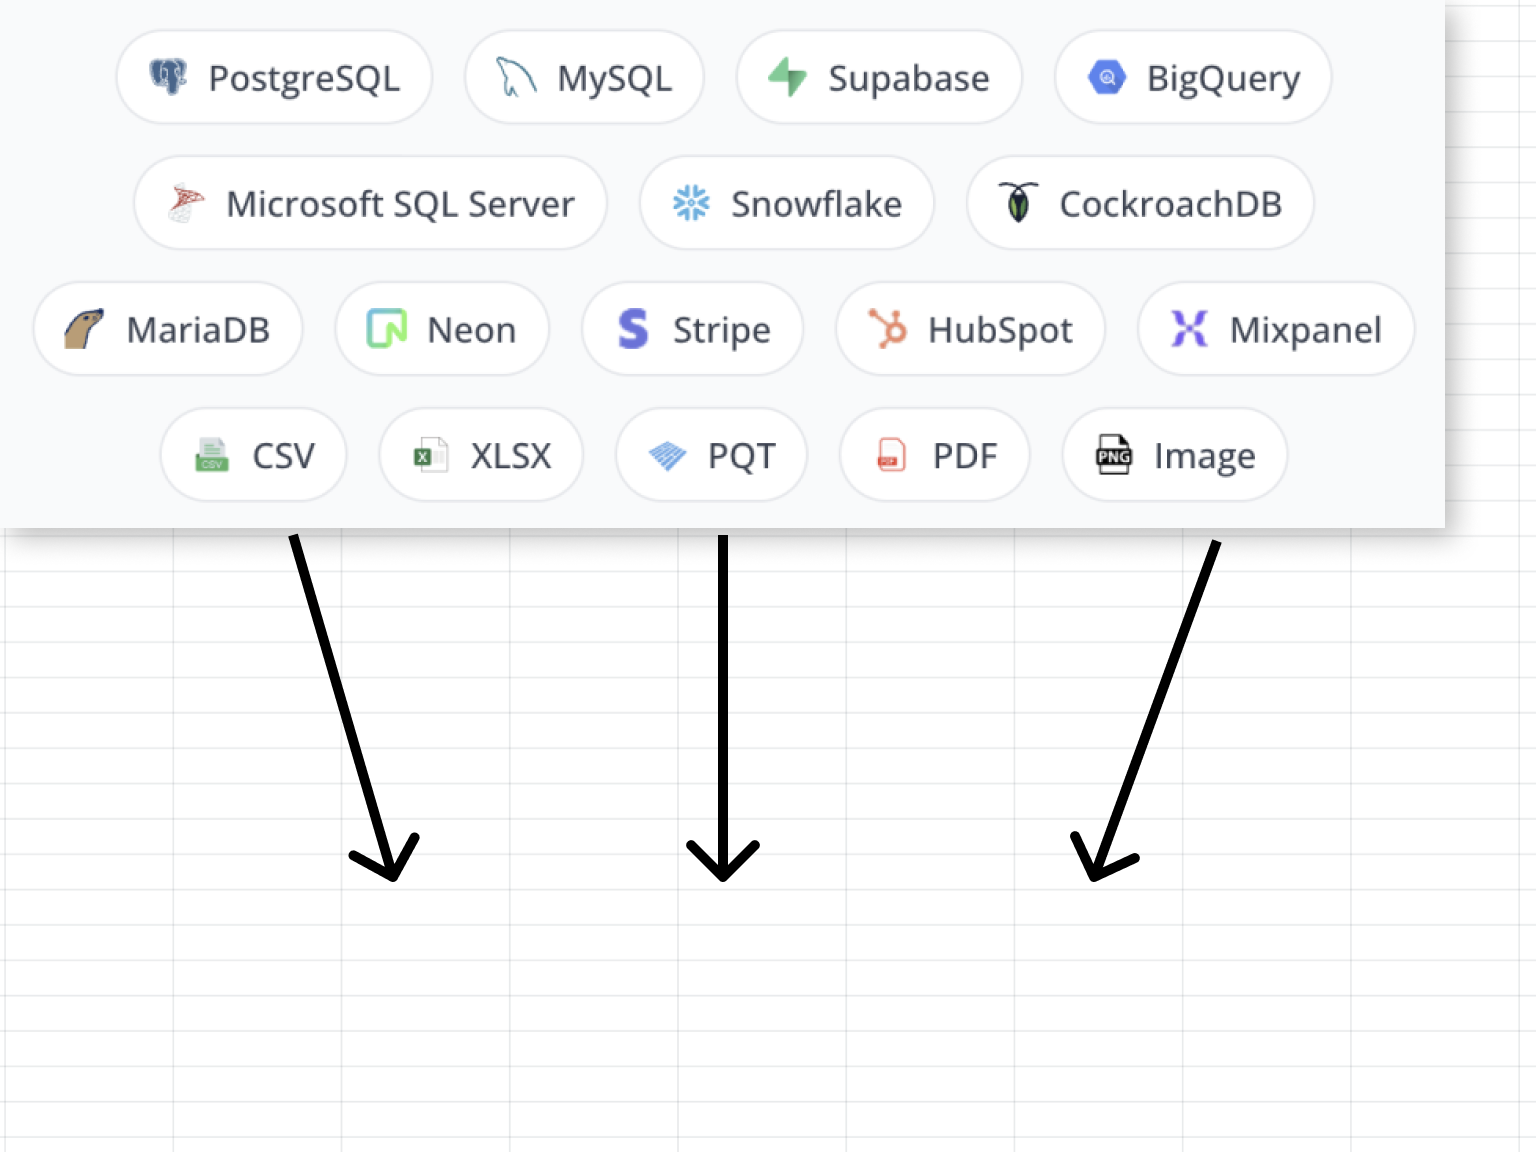
Connect to every data source instantly
Combine data from Postgres, Snowflake, BigQuery, and other tools with secure connections. Quadratic centralizes everything in one workspace so your data stays live, consistent, and ready to explore.
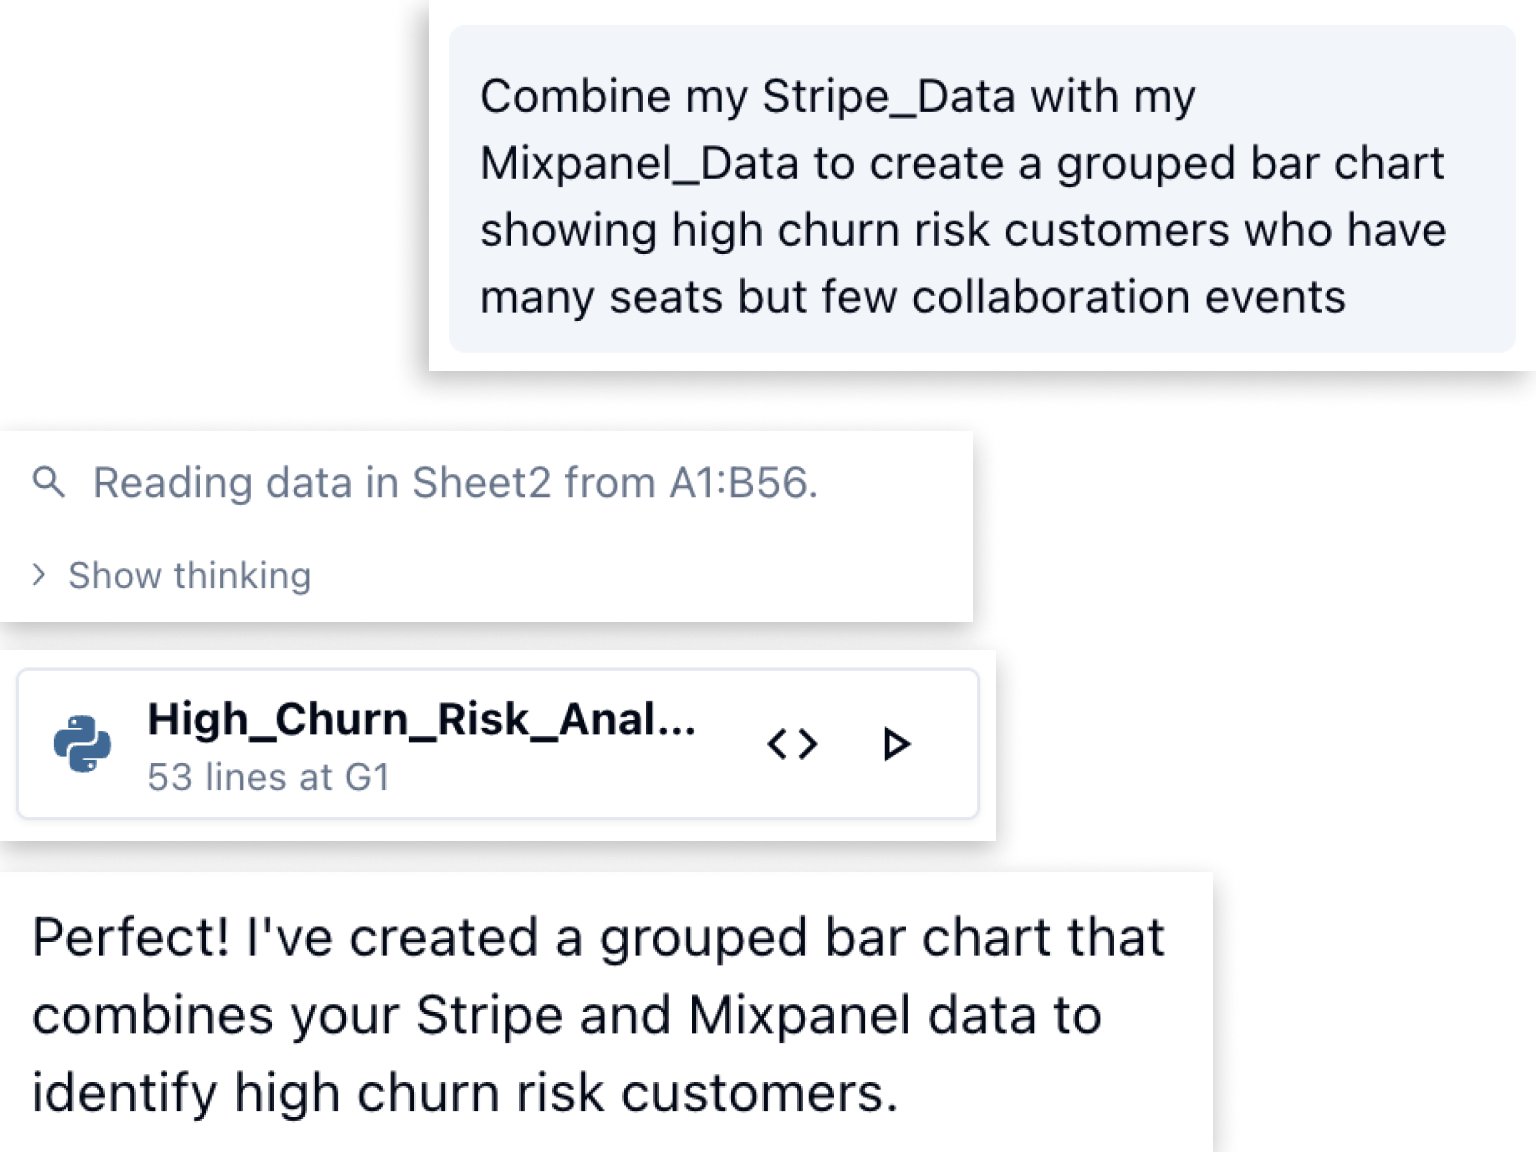
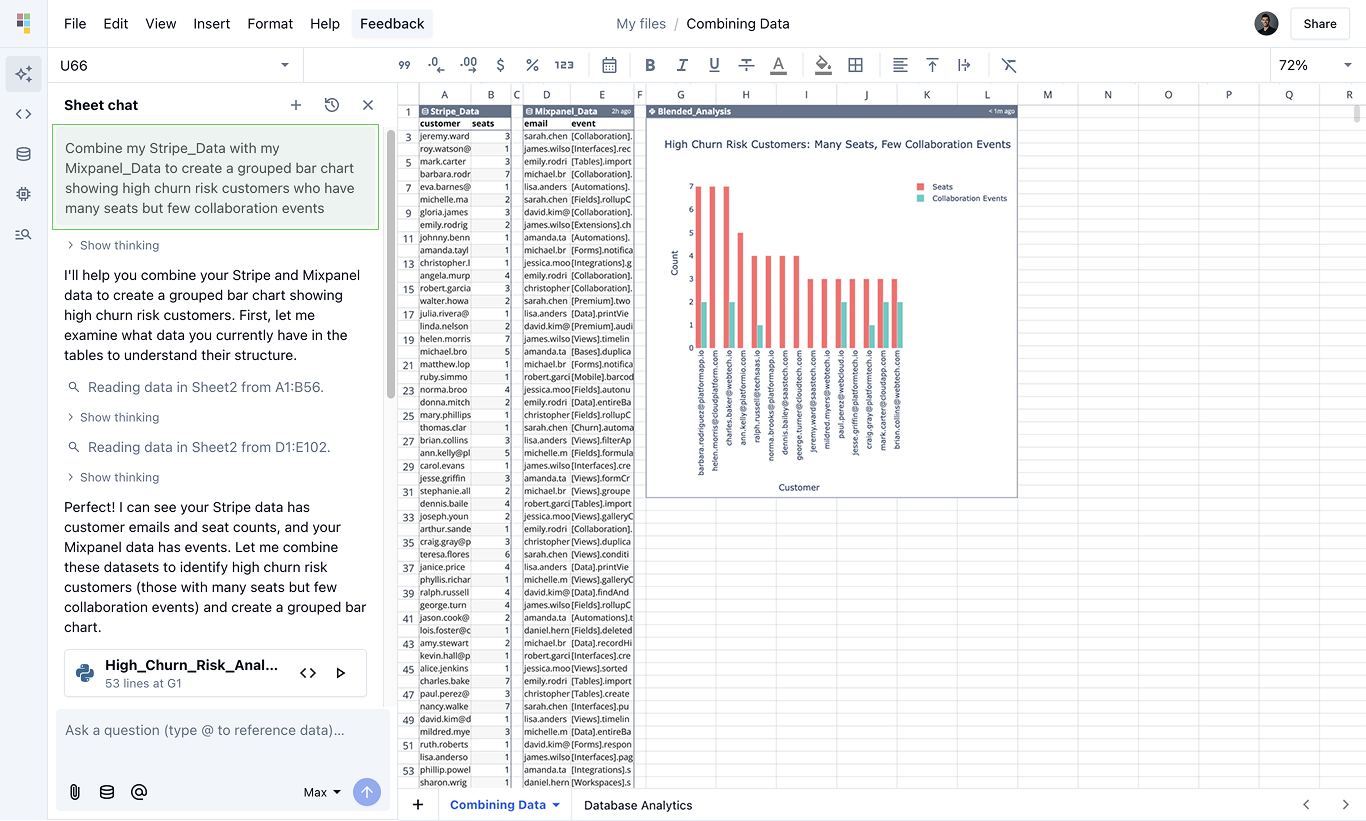
Clean and join data with AI or code
Use natural-language prompts, SQL, or Python to generate joins, filters, and transformations. Quadratic makes combining messy or mismatched datasets simple — no ETL tools required.
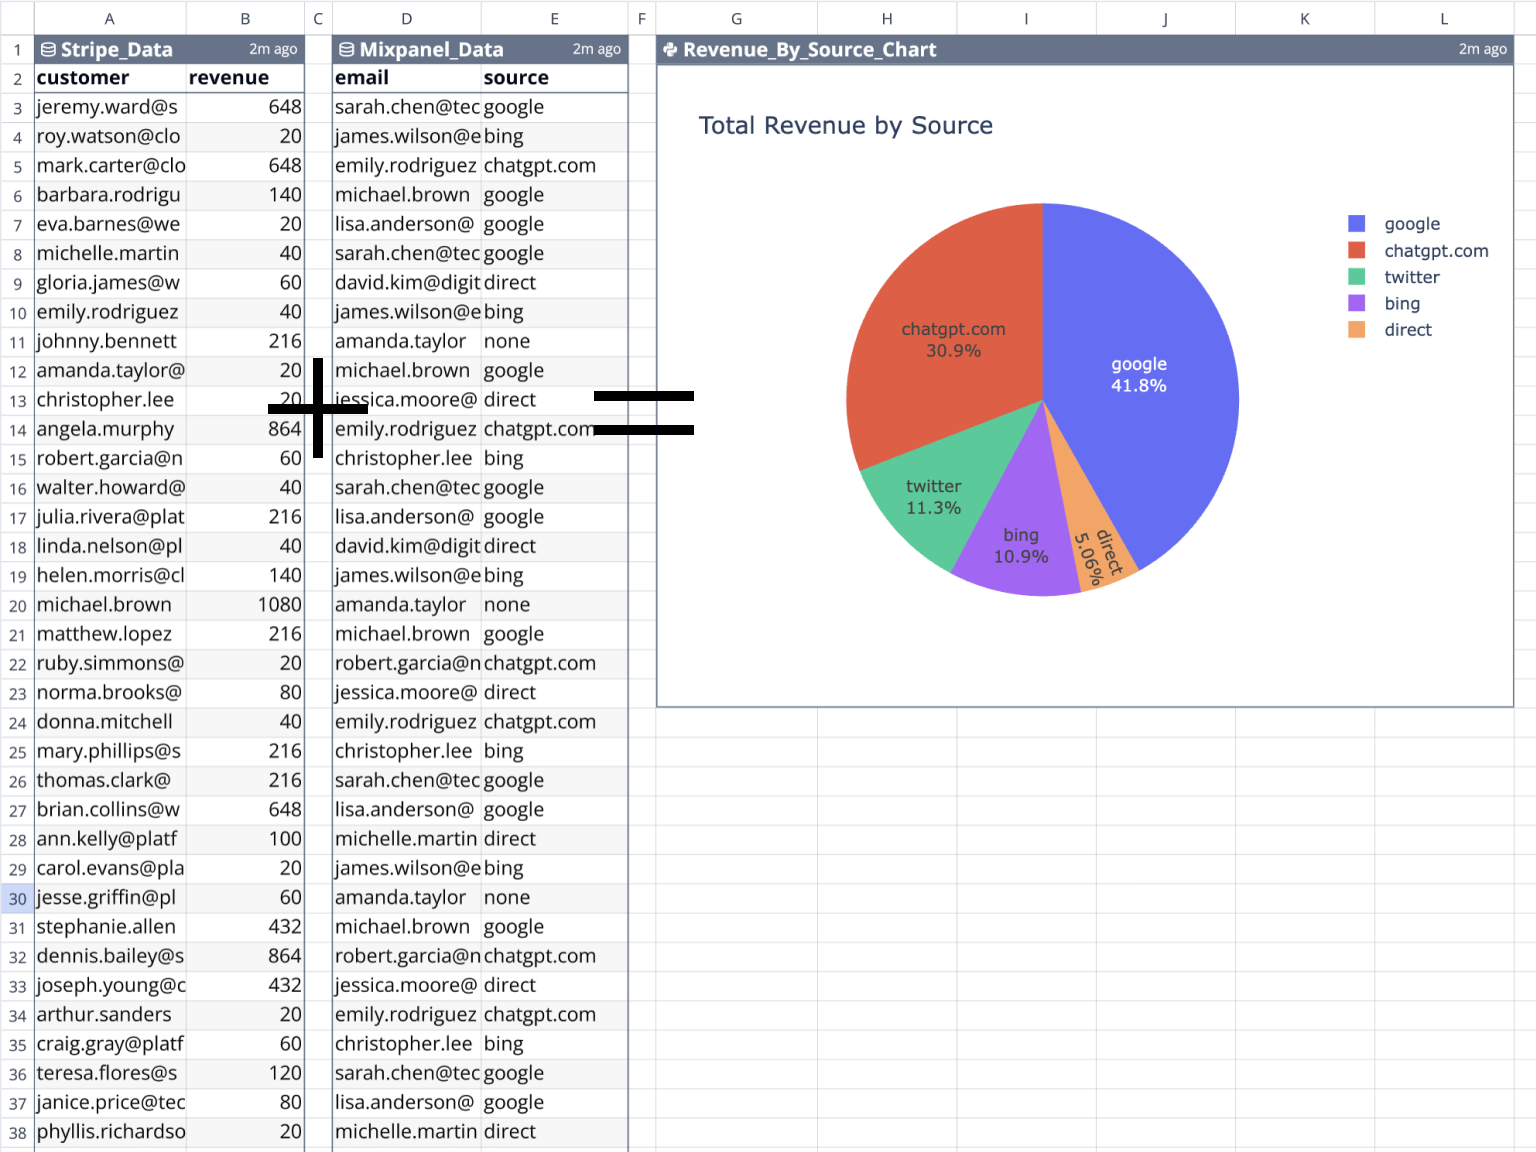
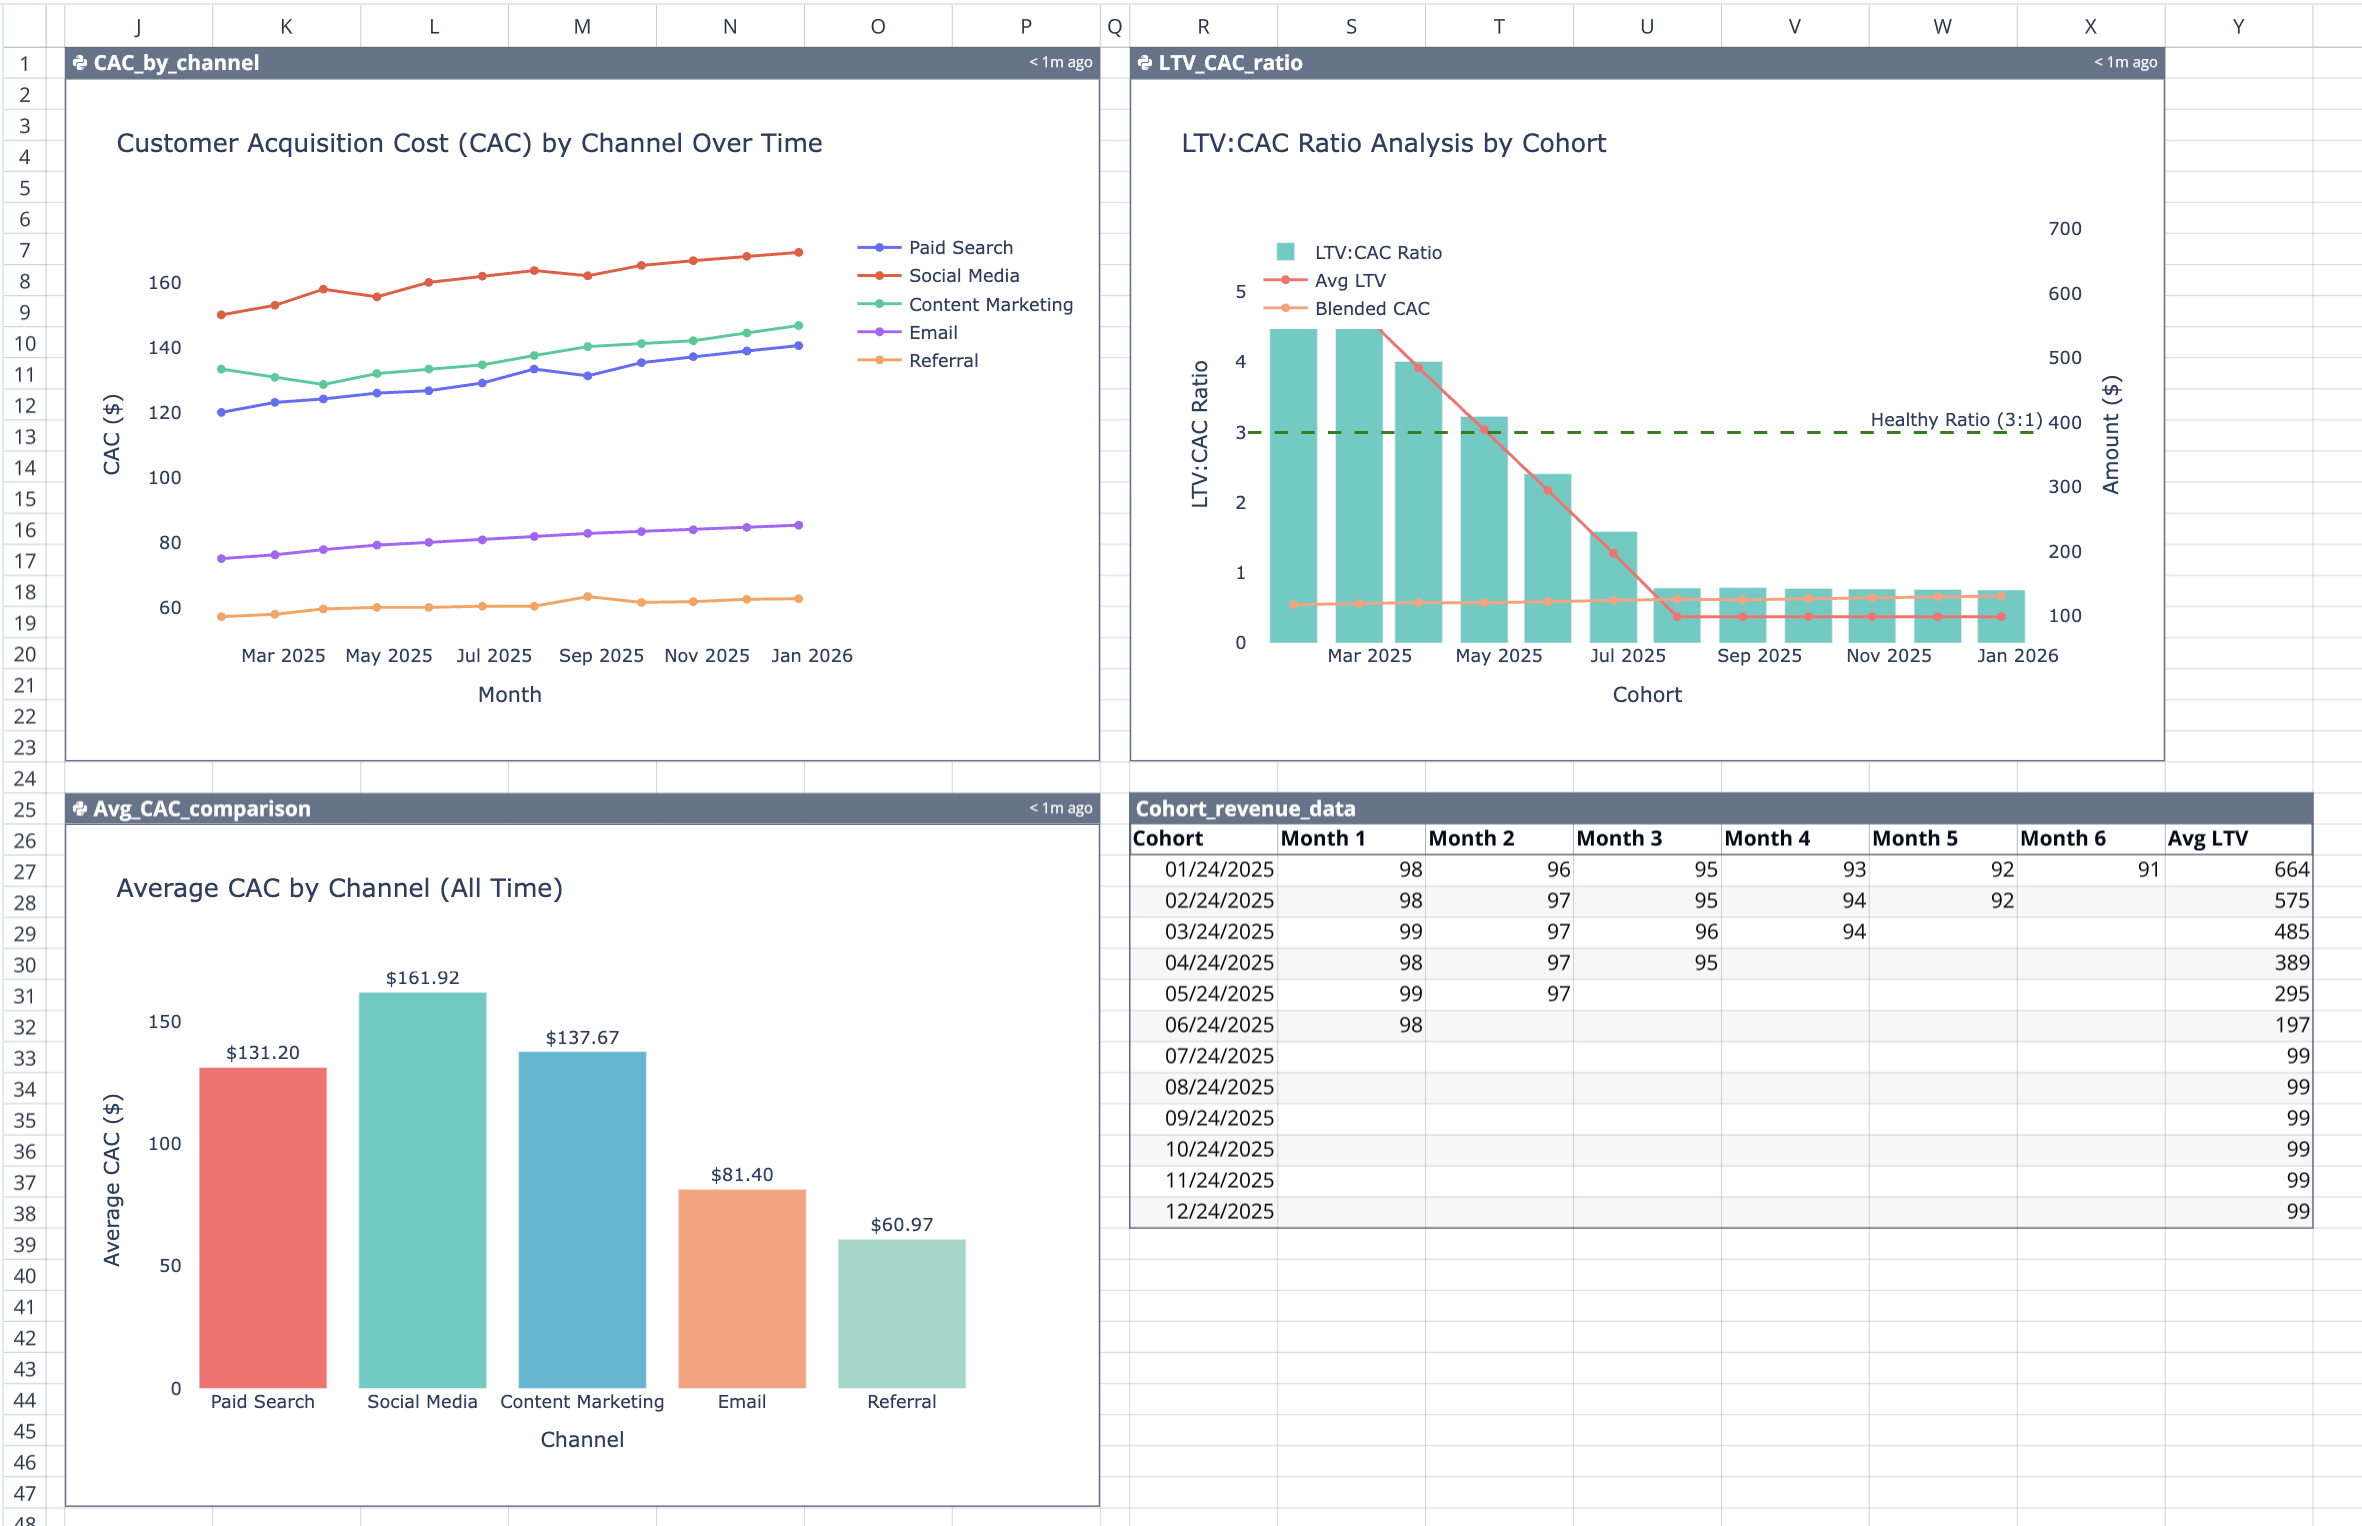
Analyze and visualize data side-by-side
Work seamlessly across SQL, Python, and formulas to calculate blended metrics and visualize results. Create pivot tables, charts, and aggregations all next to your data.
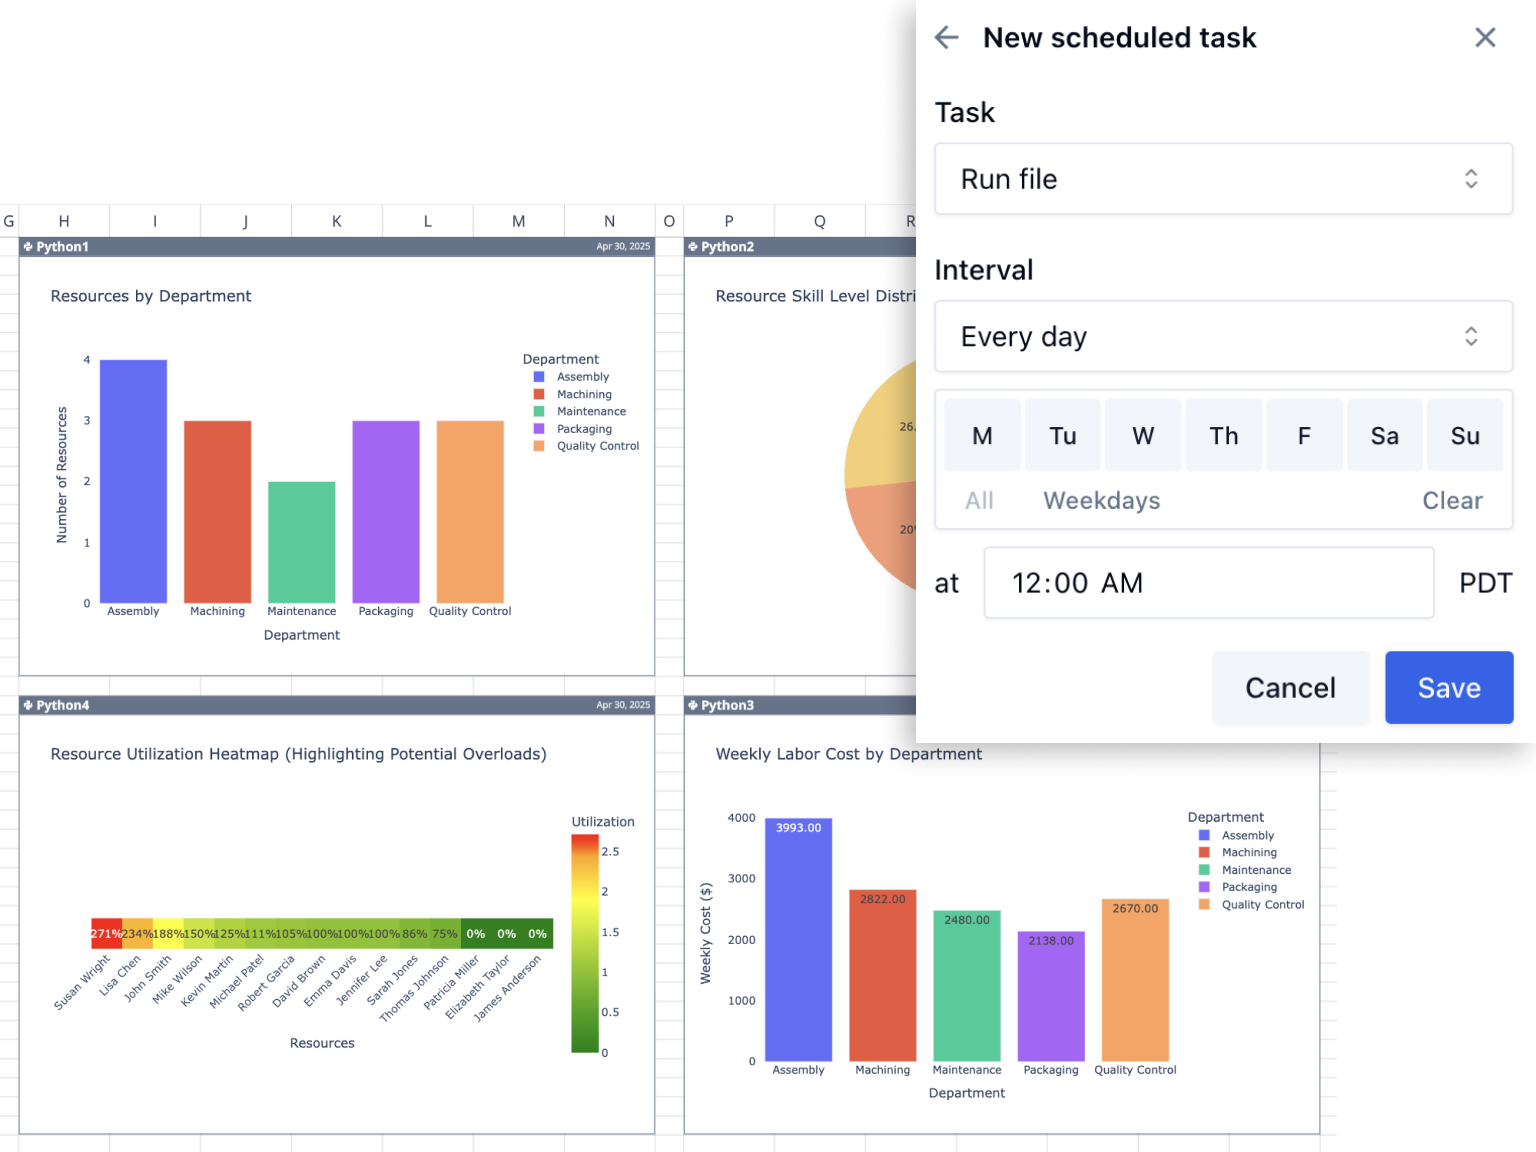
Share unified insights that stay live
Publish live dashboards that pull from every connected source, without rigid BI tools. Quadratic refreshes your data automatically, ensuring teams always see the latest truth across systems.
Data blending that scales with your analysis
See how Quadratic helps you move from fragmented sources to unified, explainable insights.
See which databases you can integrate with Quadratic
All connections
Cohort analysis: The most useful report you're not running
Read blog
Funnel analysis 101: From signup to activation
Read blog