Bring your Mixpanel data into Quadratic to analyze user behavior, explore product performance, and combine event data with other sources. Build Mixpanel dashboards and share them with your team, no BI setup required.
- Connect Mixpanel and access events, users, and properties instantly.
- Build custom Mixpanel dashboards that refresh automatically.
- Combine Mixpanel with CRM, billing, marketing, and product data.
- Use AI to ask questions about funnels, retention, and cohorts.
- Leverage Quadratic as a Mixpanel data visualization tool.
- SOC 2 and HIPAA compliant, with enterprise-grade security.
Generate reports automatically
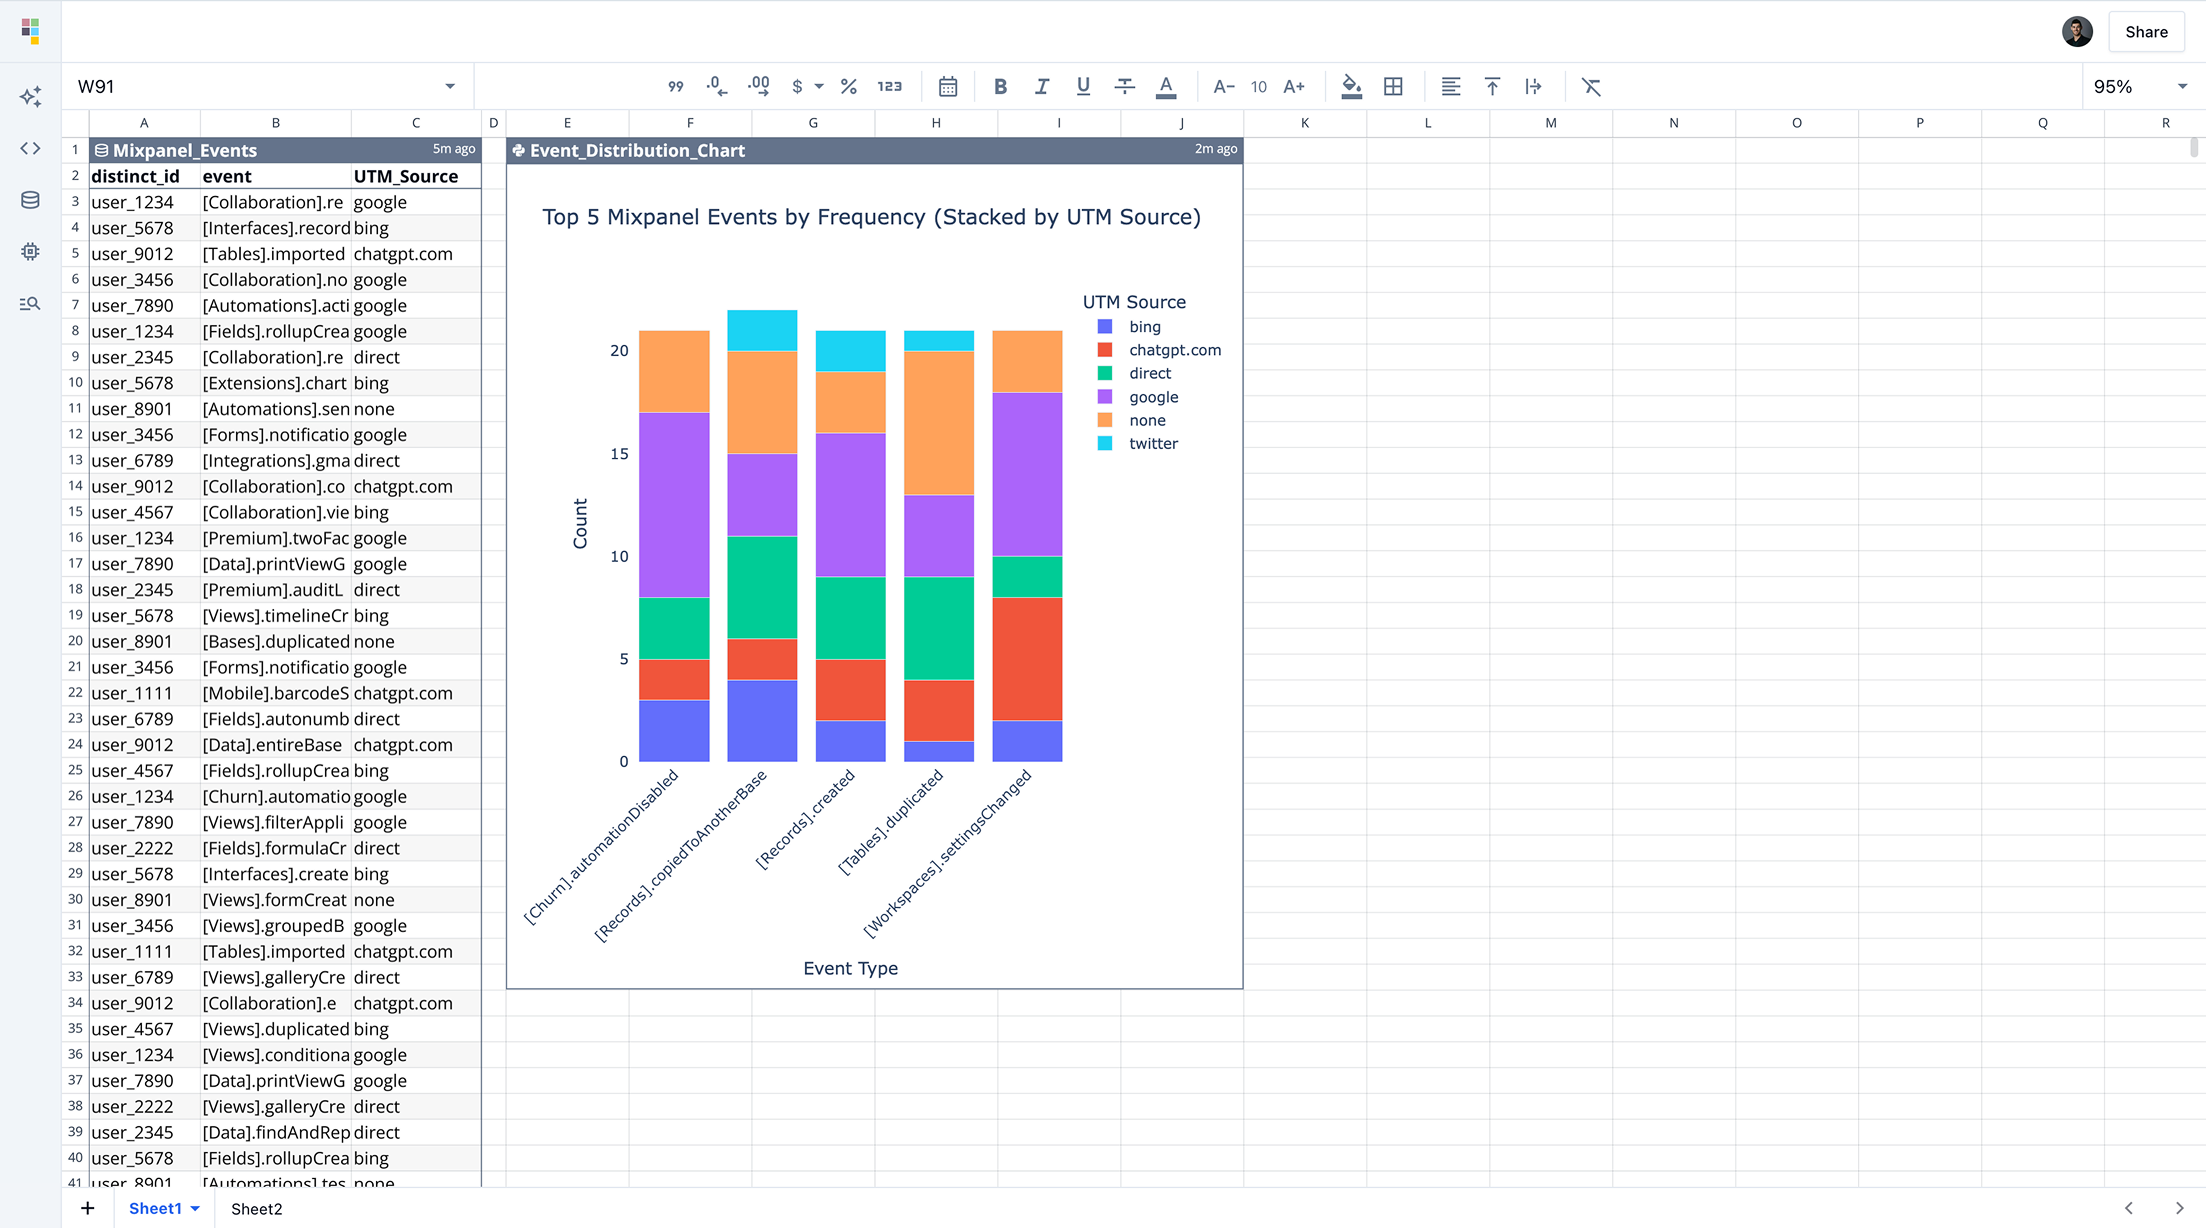
Automate product and growth reporting. Quadratic turns your Mixpanel questions into interactive tables and visualizations that stay up to date as your data changes.
Explore your Mixpanel data naturally
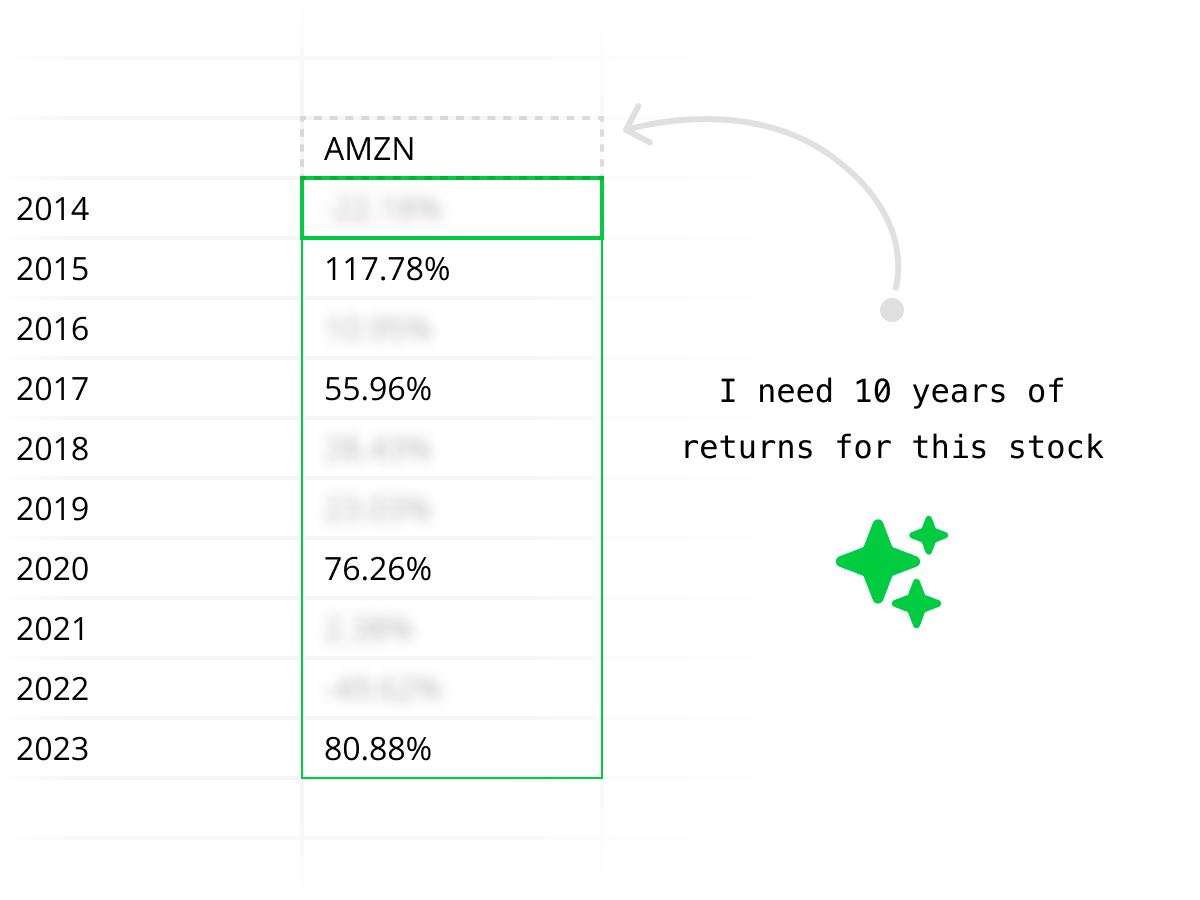
Explore events, user properties, cohorts, and other data directly in Quadratic, and simply ask questions in natural language to pull what you need.
Build dashboards with AI
Describe what you want — "show onboarding funnel drop-off by week" or "weekly retention by signup cohort" — and get charts and tables you can edit and share.
Use Cases
Mixpanel + Quadratic works for every product-focused team.
Product Teams
- Track feature adoption, onboarding funnels, and retention over time.
- Combine product events with business metrics to understand impact.
Growth Teams
- Analyze activation and conversion funnels across user segments.
- Connect Mixpanel data with marketing and revenue sources to measure ROI.
Analytics & Data Teams
- Run ad-hoc analysis without rebuilding dashboards.
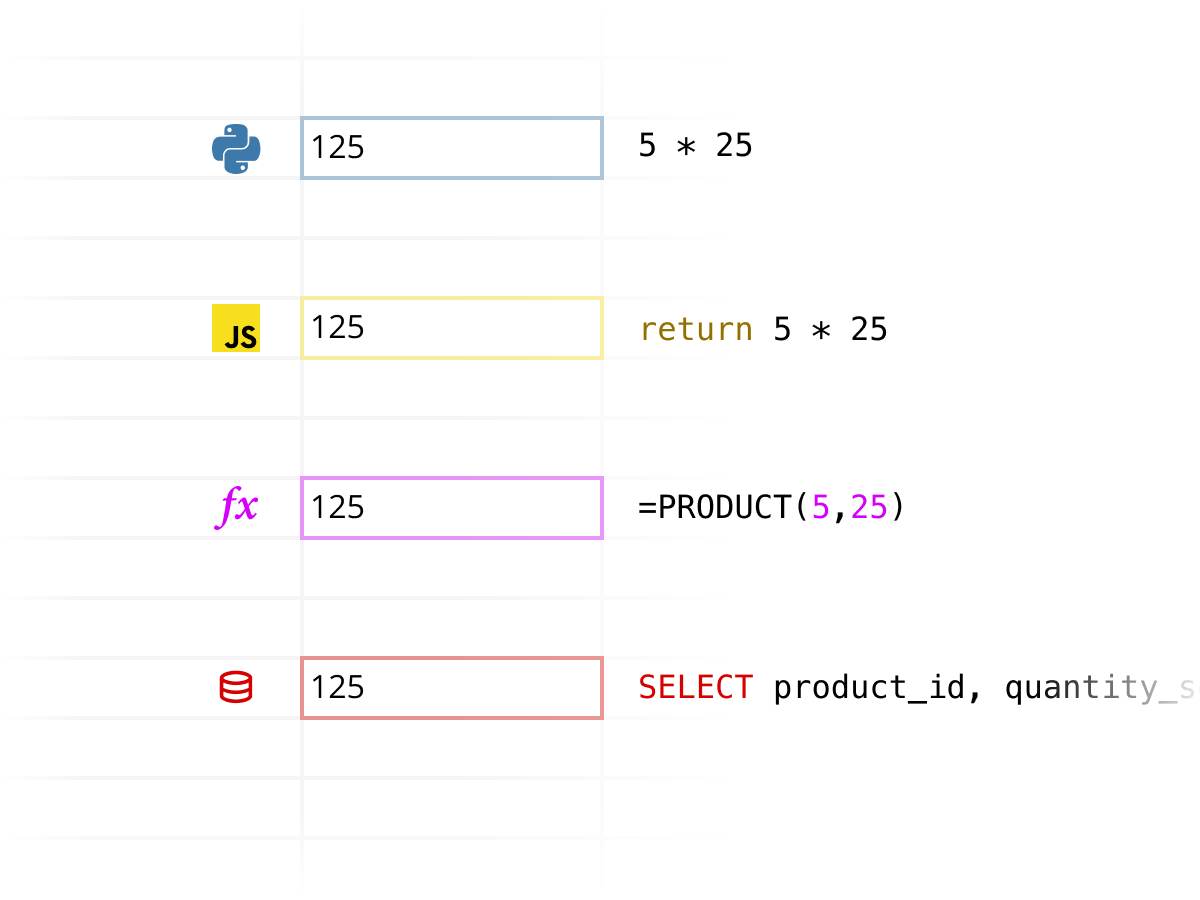
- Use SQL, Python, or formulas directly on live Mixpanel data.
Leadership & Ops
- Replace static reports with live dashboards that evolve with your product.
- Keep analysis transparent and shareable across the company.
“The ability to cross-reference multiple queries simultaneously and create custom charts with Plotly makes Quadratic significantly more powerful than traditional BI tools. The built in AI assistant is a game-changer for visualization.”
AI assisting with product analytics
Quadratic acts as your Mixpanel AI tool, capable of exploring events, building funnels, and generating retention analysis on demand. Ask questions like "Where do users drop off during onboarding?" and get instant answers.
Combine Mixpanel with Code
Go beyond built-in dashboards. Combine Mixpanel data with Python in Quadratic for advanced product analytics — from cohort analysis to experiment evaluation and LTV modeling.
Secure enterprise connections
Quadratic connects to your data with a secure Mixpanel integration. We're SOC 2 and HIPAA compliant, and support self-hosting for enterprises that need total data control.
FAQ
Why use Quadratic for Mixpanel data analysis?
Quadratic makes it easy to analyze Mixpanel data in a familiar spreadsheet interface, without the limitations of fixed dashboards or BI tools.
How do I connect Mixpanel to Quadratic?
From your Quadratic workspace, go to Connections, choose Mixpanel, and authenticate. Your events and properties will load automatically.
Can I build funnels and retention dashboards?
Yes. You can build custom funnels, retention charts, and cohort analysis that refresh automatically with live Mixpanel data.
How is this different from Mixpanel dashboards?
Mixpanel dashboards are great for predefined views. Quadratic lets you run ad-hoc analysis, blend data sources, and keep everything editable and transparent in one spreadsheet.
Do I need to know SQL or Python?
No. You can ask questions in plain language. If you want more control, you can use or extend the analysis with SQL or Python.
What does Quadratic cost?
Quadratic offers a free plan to get started, with Pro and Business tiers for additional AI features and support. See our Pricing page for details.
Explore other connections
Quadratic supports a growing list of data sources. Combine and compare data across sources using Quadratic.


