Cole Stark, Head of Growth
Jun 24, 2025

Data teams are drowning in information yet starving for insight. Government portals, SEC filings, open APIs, and academic PDFs all promise answers, if you have the patience to hunt, scrape, and clean them, or the right AI prompts for summarizing reports. Secondary data analysis is supposed to shortcut that pain by re-using existing sources, but too often the process feels like a scavenger hunt of copy-pasting and spreadsheet gymnastics.
With Quadratic’s AI Research feature, that hunt turns into a quick conversation. In this post, you’ll learn what secondary data analysis is, why it still matters, and how AI Research can pull, organise, and explore public datasets in minutes. We’ll finish with a hands-on example so you can see the 2-minute workflow end-to-end.
What’s the advantage of secondary data analysis?
Businesses, researchers, and students turn to existing datasets for one main reason: speed, whether for academic studies or a comparable company analysis. Collecting original (primary) data can require surveys, lab work, or months of field observation. A huge benefit is secondary data analysis is that it leverages information already out there, often at zero cost, so you can answer urgent questions quickly. For example:
- A product manager benchmarking competitors’ pricing
- A city planner comparing census trends
- A statistician validating statistical models and developing new methodologies
- A financial analyst conducting AI market research on a target company
Done right, the advantages of secondary data analysis include lower cost, larger sample sizes, and the ability to test ideas before investing in primary collection as part of your data analytics strategy.
What is secondary data analysis?
If you’re new to the term, here’s the elevator definition:
“Secondary data analysis is the practice of examining data that someone else has already collected for a different purpose.”
Put differently, secondary analysis of data takes “found” information like public spreadsheets, APIs, PDFs, and web tables, and answers a new question the original authors never considered.
Common types of secondary data analysis include:
- Descriptive benchmarking (e.g., GDP per capita across countries)
- Trend modelling (e.g., five-year adoption of electric vehicles)
- Meta-analysis in academic research
- Competitive intelligence in business strategy
The key challenge is no longer availability, it’s aggregation and cleaning. That’s where modern tools shine.
Traditional pain points (and how AI fixes them)
- Discovery overload – You can spend hours scrolling through Google results, hoping to land on a usable CSV.
- AI effect: a single prompt collects and organizes structured data right onto your spreadsheet, citing multiple reputable links inside the chat thread so you can continue analyzing the CSV data in seconds.
- Extraction headaches – Copy-pasting HTML tables or parsing PDFs often breaks formatting.
- AI effect: attach the PDF to the chat and ask “extract every table” and the AI PDF data extraction tool scrapes, deduplicates, and drops clean rows into your sheet.
- Structuring chaos – Units differ; dates misalign; headings vanish.
- AI effect: follow up with “format this sheet for presentation” and Quadratic applies headings, consistent units, and zebra stripes.
A hands-on secondary data analysis example
Below is a three-prompt workflow that turns scattered research on renewable energy capacity trends into an insight-ready dashboard, showing how easy it is to create a dashboard in Python.
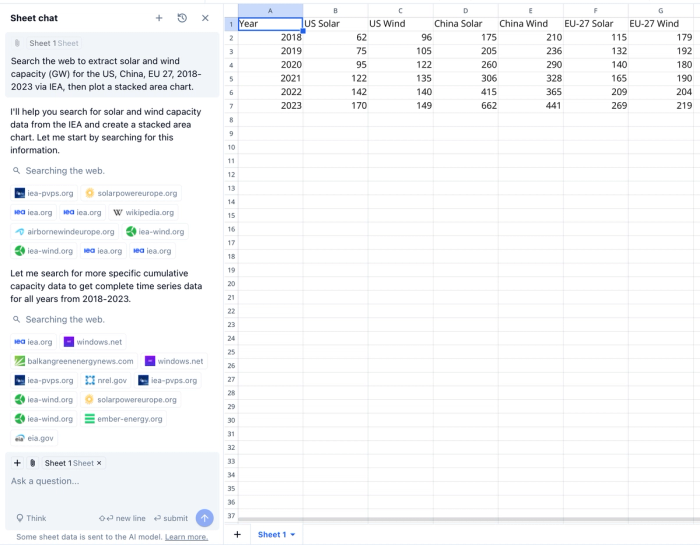
- Gather the data
- Prompt: “Search the web to extract solar and wind capacity (GW) for the US, China, EU 27, 2018-2023 via IEA.”
- AI Research scrapes the latest IEA tables, lists source URLs in chat, and inserts a clean grid with six years of capacity data for both technologies across the three regions.
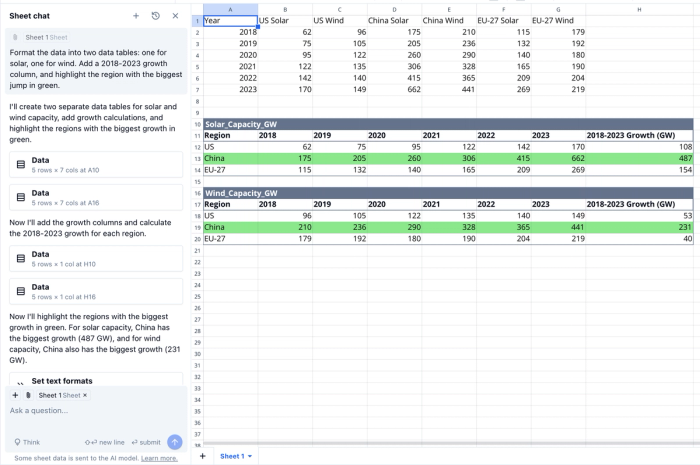
- Tidy and highlight
- Prompt: “Format the data into two data tables: one for solar, one for wind. Add a 2018-2023 growth column, and highlight the region with the biggest jump in green.”
- Flat data turns into tables, headings turn bold, a new column appears, and the top performer is colour-coded.
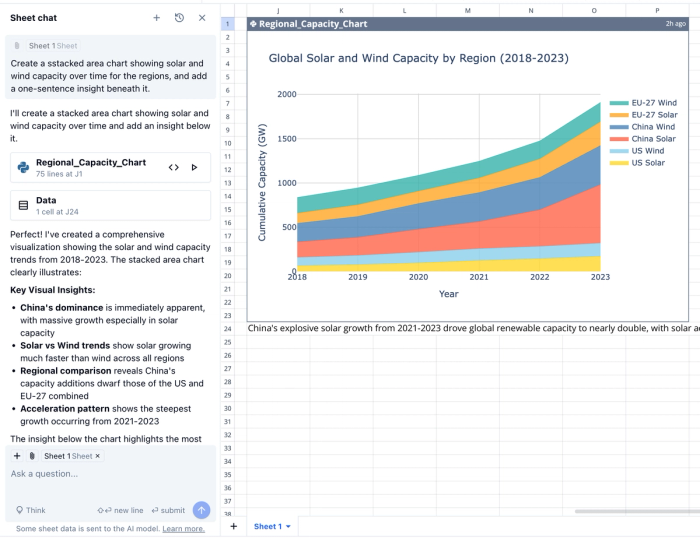
- Visualise the story
- Prompt: “Create a stacked area chart showing solar and wind capacity over time for the regions, and add a one-sentence insight beneath it.”
- Quadratic builds the chart and adds commentary: “China's explosive solar growth from 2021-2023 drove global renewable capacity to nearly double, with solar additions alone exceeding the total renewable capacity of most nations.”
Within minutes, you have a fully-sourced dashboard. Proof that AI-driven secondary data analysis can be both fast and audit-ready.
Best practices for analyzing secondary data with AI
- Start broad, narrow later. An open-ended prompt surfaces datasets you didn’t know existed, then you can refine as you learn more about the data. Not only is AI great at sourcing raw data from the web, but it’s even better for data exploration when you don’t know which questions to ask.
- Be explicit about units and dates. Specify “USD millions” or “2019–2024” so the AI harmonises metrics correctly.
- Paste sensitive API keys after code is generated. If your data is kept behind an API, you’ll likely need to set up an API key to access the dataset for further analysis. Keep your secrets local while letting AI handle boilerplate, then paste in your key into the Python code after.
- Check and log your sources. The AI chat aggregates data sources, but it doesn’t add a source next to every data point in the grid. Make sure to double-check sources and paste them into your sheet for transparency amongst your team.
When to use AI Research, and when not to
Quadratic shines when publicly available or API-accessible information can answer your question. If insight depends on proprietary databases or on-the-ground surveys, you’ll still need primary collection. Think of AI Research as the accelerator for secondary data analysis workflows: let it cover the desk-research phase so your team can focus resources where AI can’t tread.
Conclusion
From secondary data analysis techniques in academia to quick competitor benchmarks in business, the limiting factor has typically been the labor of gathering and cleaning data.
Quadratic AI removes that bottleneck. One conversational interface now discovers sources, structures tables, and runs code without leaving the grid, far surpassing basic ChatGPT for Excel workflows. If you’ve wrestled with CSVs and endless browser tabs, secondary data analysis is no longer a 5-hour block on your calendar; it’s a prompt away.
Ready to try it? Open a free Quadratic file, paste any prompt that includes words like “search the web”, and watch AI-powered secondary data analysis turn raw web pages into ready-to-share insight with AI.