
Cole Stark, Head of Growth
Jun 17, 2025

What if creating a full market research report took you a few minutes instead of a few hours, without ever leaving your spreadsheet?
That was the challenge behind Quadratic’s new AI Research feature, and the result is promising for anyone exploring AI tools for market research. In this post, we’ll walk through the exact workflow I used to build a complete Apple equity report in under four minutes, then zoom out to see how AI-powered market research is evolving, and why Quadratic is the next logical step.
Why talk about AI and market research now?
Before we dive into the demo, we should discuss what exactly AI market research means, how it’s evolved over the years, and why we do market research in the first place.
In a world overflowing with public filings, news, social chatter, and API-ready datasets, market research is the discipline of turning that scattered information into clear decisions, whether you’re drafting a pitch deck, validating a product idea, or writing a thesis. Traditional tools force you to hunt, copy, and cobble these sources together; modern AI for market research collapses that work into a single, conversational step, letting you focus on insight rather than information wrangling.
1. A short history of AI in market research
| Era | Typical workflow | Core limitation |
|---|---|---|
| Pre-AI | Manual data collection → Excel crunching → Slide creation | Time-consuming, error-prone |
| First-gen market research tools (2018-2022) | SaaS platforms that scraped the web & generated static PDFs | Little transparency, hard to customize |
| AI-driven market research (ChatGPT era) | LLMs summarize public info in a chat window | Great for ideas, weak on citations. Stale data and a lack of tabular structuring |
| Today: Context-rich AI | AI Research in Quadratic pulls live, cited data into the grid you already use | Data, analysis, narrative, and sources all live together |
While manual online research is always an option and required for more advanced use cases like writing your dissertation, the key takeaway in this evolution is that modern AI market research tools are shifting from black-box answers to organized, trustworthy data presentations.
2. Why analysts still juggle with market research tools
Even with newer market research AI tools like Perplexity AI, Quantilope, and AlphaSense, users often bounce between:
- A browser (to find stats)
- A spreadsheet (to crunch and organize numbers)
- A BI tool (to create data visualizations)
- A slide deck (to present findings)
Each hop introduces friction and assumptions. AI and market research reach full potential when multiple steps collapse into one workspace.
3. How Quadratic reimagines AI-powered market research
- Web search + sheet context + citations from a single prompt
- AI Formatting so raw output is presentation-ready
- Code generation (Python, SQL, JavaScript) to help you analyze, visualize, and understand raw data points
- Real-time API calls without reading 40-page docs
In short, it’s market research with AI that stays transparent, editable, and auditable.
The Apple demo: Building an equity report in five prompts
Below is the exact flow I showcased in my recent YouTube video “Instant AI Market Research with Quadratic’s AI Research Tool.” Feel free to copy-paste these AI prompts for market research into your own sheet.
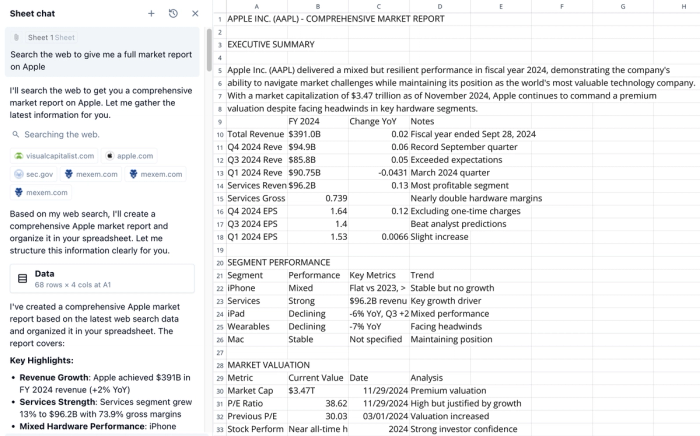
Step 1: Ask for the report data
- Prompt: “Search the web and build me a full market research report on Apple.”
- What happened: AI searches various URLs, then drops an Executive Summary, Financial Overview, Segment Performance, Market Valuation, and other useful online data into the grid.
- Why it matters: Shows that vague prompts still return structured, cited data, perfect for further market analysis.
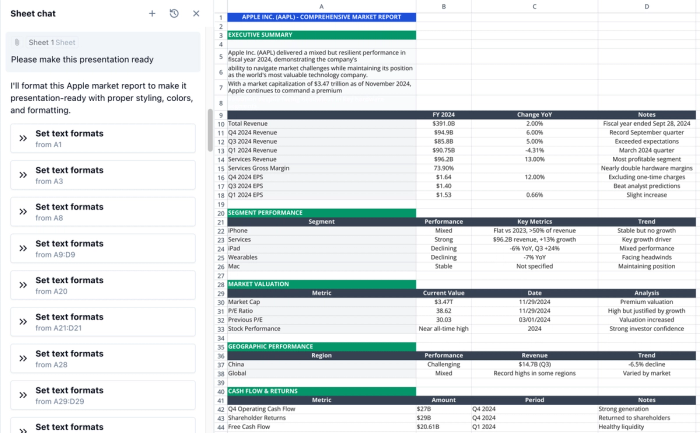
Step 2: Polish the layout
- Prompt: “Make this presentation-ready.”
- What happened: Headings bolded, corporate color palette applied, spacing fixed.
- Why it matters: Slashes formatting time; keeps you focused on insight, not cell borders.
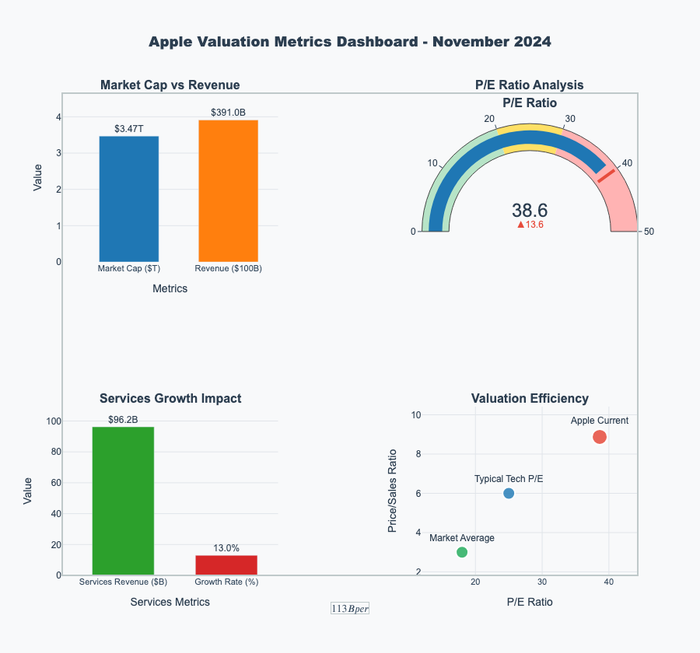
Step 3: Add key visuals
- Prompt: “Create a chart of expected vs actual revenue for the past five years.” and “Create a valuation metrics dashboard.”
- What happened: AI reads the data from the sheet, writes Python to insert different kinds of charts, and labels axes.
- Why it matters: Demonstrates Quadratic as a sophisticated AI tool for data analysis, not just AI search. Data visualizations are often the most compelling elements of a data story.
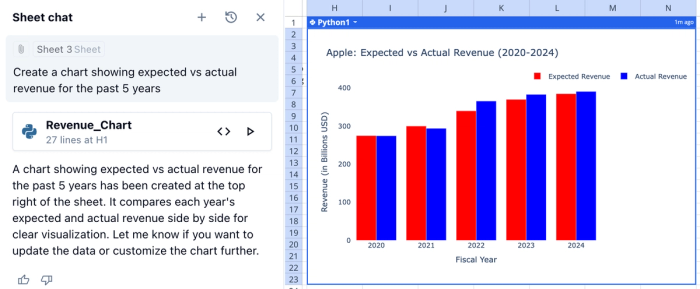
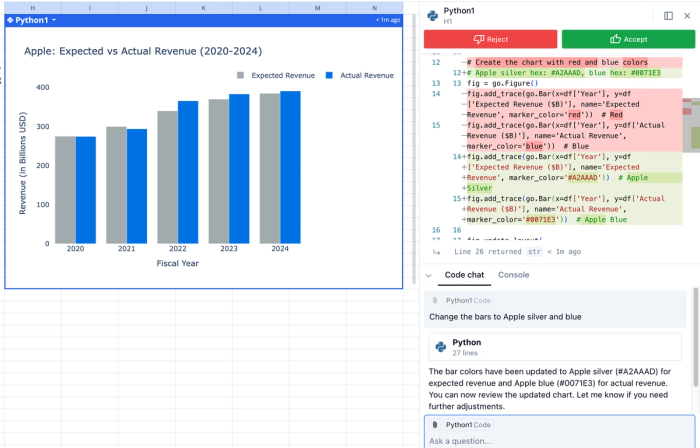
Step 4: Style the chart
- Prompt: “Change the bars to Apple silver and blue.” (This prompt was done within the code-specific chat view, by opening up the initially generated code cell.)
- What happened: AI rewrites the Python code behind the chart; colors update instantly.
- Why it matters: Highlights iterative, conversational analysis without leaving the sheet or having to navigate excessive manual options.
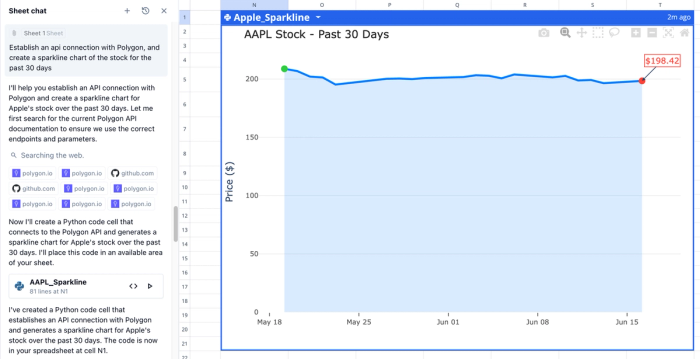
Step 5: Real-time API data
- Prompt: “Establish an API connection with Polygon, and create a sparkline chart of the stock for the past 30 days”
- What happened: AI reads docs, writes requests, fetches data, and renders a sparkline chart with Python libraries like Pandas and Plotly.
- Why it matters: Empowers non-technical users to achieve otherwise technical feats in seconds.
What this tells us about the future of AI market research tools
The Apple demo hints at a bigger shift in market research AI. First, sheer speed is quickly becoming table stakes; the lasting advantage is transparency. Stakeholders can audit sources on the spot with clickable citations while analysts and developers can audit chart accuracy within Python code, turning “trust me” black-box outputs into verifiable evidence.
Second, conversation is replacing the old extract-transform-load pipeline. Instead of shuttling data from one app to another, you refine insights through natural-language back-and-forth, creating a living document that evolves with each follow-up question.
Third, custom code isn’t an afterthought—it sits side-by-side with narrative and data. Need a quick regression or Monte Carlo simulation? Ask the AI to generate the model, tweak it if necessary, and rerun code cells without leaving the grid.
Finally, the workflow is universal. While the example focused on finance, the same method can power tax and economic analysis, industry benchmarks, or company data enrichment.
The future of AI market research tools is conversational, transparent, and adaptable—moving from static dashboards to interactive canvases where insight, computation, and provenance coexist.
Tips for your first AI-powered market research project
- Start broad, then drill down. Let the AI gather a wide net of info and refine later. It’s easy to get bogged down in “what prompt do I need to ask”? Sometimes the best path to data exploration is to start anywhere and then iterate as you go.
- Keep sensitive keys local. Paste API tokens after the code is generated to avoid sharing secrets with the model. This is just good security hygiene until Quadratic supports secrets within the app.
- Use AI Formatting last. Polish your data once the content stabilizes to prevent restyling.
- Cite your sources. Quadratic will pull a list of sources into the AI chat as it researches, but chat activity is not shared across your team, it’s personal to you. Make sure to verify the data source and paste those links next to your most important claims.
Conclusion
Traditional market research platforms either hide the mechanics or force analysts into rigid dashboards. Quadratic flips the script by letting you:
- Search, analyze, and visualize in one place
- Keep code and context side-by-side
- Share a living document that teammates can audit or extend
If you’ve been stitching together multiple AI tools for market research, give Quadratic a spin. Your next company deep dive, product benchmark, or academic white paper might be just five prompts away.
Try Quadratic AI Research free and let us know what you build, we’d love to share what’s working with other users!