James Amoo, Community Partner
Jun 5, 2025

Table of contents
Artificial Intelligence is not just changing the way we analyze data; it is also offering unparalleled speed and efficiency in generating insights from data. With the integration of AI in data analysis, tasks that previously required days or even weeks can now be accomplished in just hours or minutes. Users are empowered to extract insights from their data and make data-driven decisions.
While AI has the potential to significantly streamline data analysis, integrating it effectively into your workflow requires careful consideration due to the numerous tools available on the market. To an extent, maximizing its benefits depends on selecting the right tool that aligns with your specific needs. The ideal AI tool for data analysis should be able to streamline a variety of tasks while being user-friendly and accessible to individuals of various skill sets.
In this blog post, we’ll discuss the top 5 best AI tools for data analysis that automate processes involved in data analysis. We’ll also explore their features and explain how they help you uncover meaningful insights and make more informed, data-driven decisions.
1. Quadratic AI
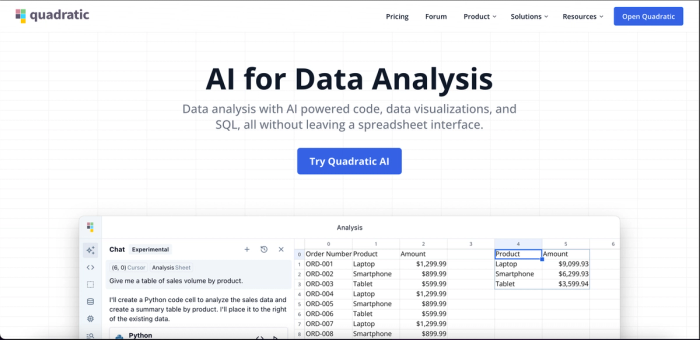
Quadratic is an AI-powered spreadsheet designed to simplify the entire data analysis process, offering assistance every step of the way. From data cleaning and data exploration to analysis and visualization, it handles tasks seamlessly and allows users to generate insights faster. Quadratic is browser-based, which means users do not need any manual installation to get started.
A major advantage of using Quadratic when compared to other tools is that it offers a centralized environment to perform all data analysis tasks, eliminating the need to switch between multiple tools. This not only reduces friction in the workflow but also enables users to focus more on uncovering actionable insights quickly and efficiently. This makes it one of the best free AI tools for data analysis.
Quadratic offers an intuitive environment that makes it easy for technical users, citizen developers, and non-technical users to analyze their data and make informed decisions. Its robust AI assistance enables users to perform complex AI spreadsheet analysis even with minimal technical knowledge or coding expertise. This promotes data democratization and accessibility in organizations and also allows users to easily self-serve analytics. Let’s explore the key features of Quadratic.
Features of Quadratic
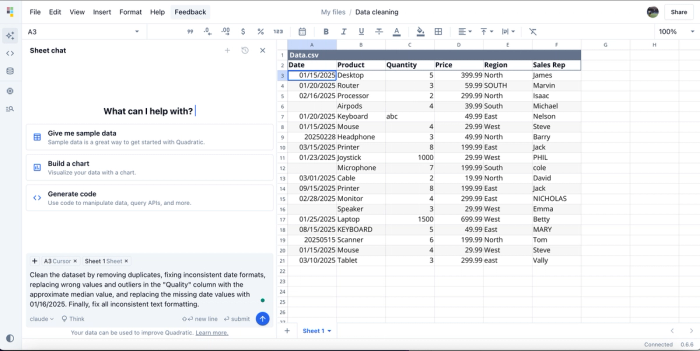
- Automated data cleaning: Low quality data can negatively impact analyses and lead to poor decision-making. Manually cleaning data can be a difficult task, as users do not specifically know the kind of dirty data to expect. Quadratic accelerates the process by allowing users to automatically remove several inconsistencies in their data, including missing values, duplicate records, and outliers. Let’s see how we can clean data in Quadratic. Here’s a sample of a dirty dataset uploaded in Quadratic:
To clean our data, we simply ask Quadratic to handle inconsistencies like duplicate data, outliers, wrong values, and missing values. Here’s the cleaned data after we enter the command:
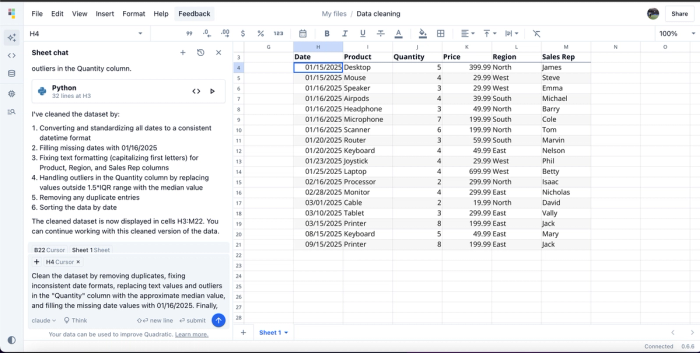
With one AI prompt, we standardized all date formats, filled in missing values, fixed formatting, handled outliers, removed duplicate values, and sorted our dataset in a more suitable format for analysis. A dataset with various inconsistencies could take hours to get a cleaned version, but Quadratic allows you to effortlessly clean data in seconds.
- AI assistance for data analysis: Quadratic’s built-in AI allows users to derive insights from their data in seconds by using simple text prompts. Rather than spend a ton of time writing complex code or trying to figure out the logic to analyze your data, Quadratic allows you to achieve this by simply asking using natural language queries, then it generates formulas or code to perform analysis on your data. Let’s see how this works.
Consider the finance dataset below:
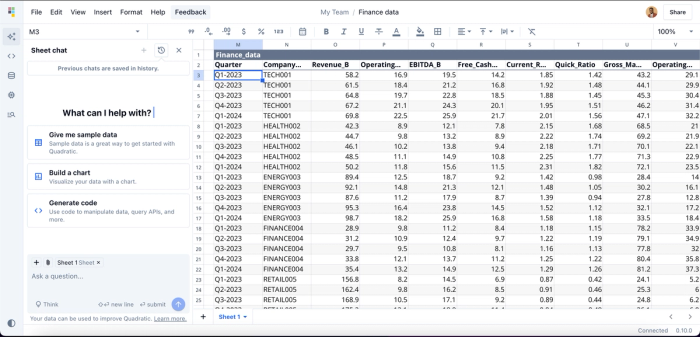
We can gain several insights from this data by simply asking. For example, we could get the best-performing company based on revenue generated:
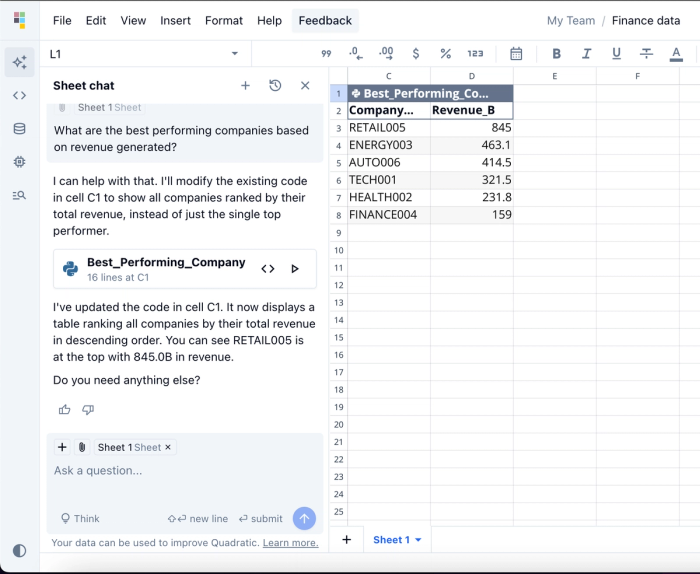
In the image above, Quadratic AI ranked the best-performing companies according to their revenue generated, just as we asked using text prompts. Users can also leverage Quadratic AI to summarize a data table, analyze CSV data, or update pivot tables automatically.
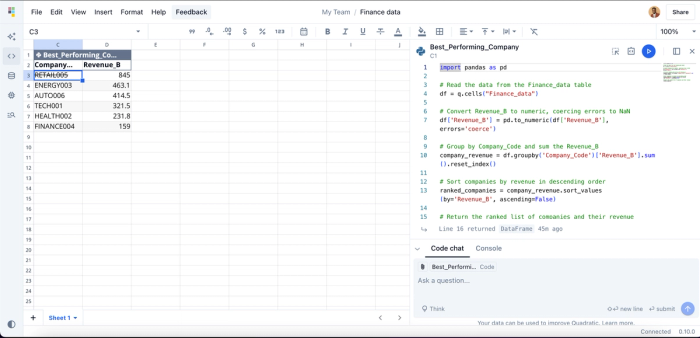
- Native support for modern programming languages: Quadratic natively supports coding in modern programming languages like Python, SQL, and JavaScript. This offers flexibility to technical users who want full control of their analyses. Quadratic provides a built-in code editor where users can write and execute code right within the spreadsheet. Here’s the code equivalent of the analysis we conducted earlier:
- Data visualization: Users can seamlessly visualize their data by passing natural language queries that describe how they want to present their data. It instantly generates Python code to visualize your data using built-in Plotly libraries. Quadratic supports different chart types and also recommends the most suitable chart type based on your data. Let’s see how we can create visualizations from our financial data:
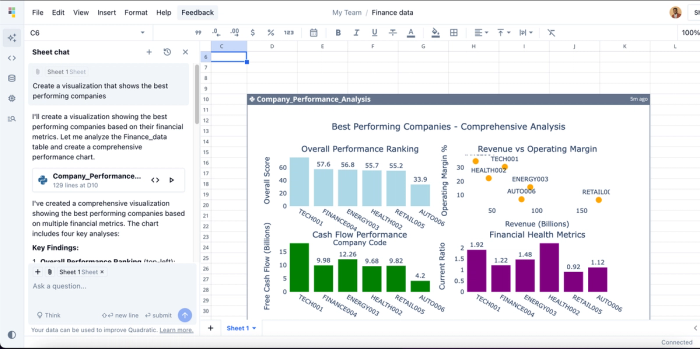
In the image above, we asked Quadratic to create a visualization of the best-performing companies. Since we didn’t specify the metric to follow, it generated several charts based on different financial metrics such as cash flow performance, financial health, the relationship between revenue vs operating margin, and the overall performance ranking—all from a single text prompt. Charts generated in Quadratic are highly customizable; users can modify different visual elements such as colors, labels, and axes.
- Templates: Quadratic offers a variety of customizable templates that help you achieve your desired result even faster. These templates are built so users do not have to start from scratch when performing advanced analysis. They cover a wide range of analysis tasks, including sentiment analysis, stock market analysis, time series analysis, and FMEA analysis.
- Multiple data sources: Quadratic connects directly with multiple databases, APIs, and raw data. Simply import (or connect to) your data, and it’s instantly ready for analysis with no additional setup.
- Collaboration: Quadratic provides a collaborative environment that enables users to simultaneously view, edit, and analyze data in real time.
- Performance: Being built on modern web app architecture, Quadratic provides a smooth and highly responsive experience, even when dealing with large datasets. Users can focus on performing simple and complex analyses without worrying about performance bottlenecks.
2. Power BI
Power BI is a data analytics and business intelligence (BI) platform that enables businesses to analyze, visualize, and share data. It integrates seamlessly with other tools in the Microsoft ecosystem. Power BI comes with pre-built connectors that enable users to import data from nearly any source.
Power BI simplifies data analysis by offering AI-powered features such as AI insights, anomaly detection, and key influencer analysis. It is also built to handle large datasets. A major drawback of Power BI is that it requires a level of technical expertise to use its advanced functionalities, including AI tools.
Features of Power BI
- AI insights: Users can leverage AI to quickly identify trends, patterns, and outliers in their data.
- Integration with Microsoft tools: Power BI integrates with other Microsoft tools, including Excel, SQL Server, and Azure. Users can easily add AI to their data analysis across different tools.
- Anomaly detection: Users can leverage Power BI’s built-in anomaly detection capability to automatically identify anomalies or unexpected patterns in their data. It’s particularly useful in time series analysis where sudden changes in data are important.
- Multiple data sources: Power BI offers direct connection with hundreds of data sources.
3. Tableau
Tableau is a powerful business intelligence and data visualization platform that helps individuals and businesses transform raw data into actionable insights. Tableau comes with a variety of AI features, including Tableau GPT and Tableau Pulse. These features help to streamline data preparation, analysis, and visualization. Its drag-and-drop interface makes it easy for users to connect to various data sources.
Tableau is available in different versions, including a desktop app, server, and web options. New users may face difficulty in using Tableau as it is very feature-rich. Thanks to its extensive community of users, there is a wealth of resources for learning and support. Compared to other tools, the paid versions of Tableau are costly, which can be a barrier for smaller organizations. See the best alternatives to Power BI and Tableau.
Features of Tableau
- AI capabilities: Tableau comes with robust AI capabilities, such as Ask Data and Explain Data, that streamline data analysis by leveraging natural language queries to ask questions about their data and provide further explanation for outliers and anomalies.
- Einstein discovery: Users can leverage Tableau’s business-first ML platform that provides predictive modeling and recommendations directly within Tableau’s interface. It learns patterns from historical data, which can then be used to predict future outcomes.
- Advanced visualizations: Tableau enables users to create interactive and dynamic visualizations, aiding better data exploration. It supports a wide range of chart types, including line graphs, bar charts, and maps.
- Collaboration: Tableau enables seamless collaboration, allowing users to share dashboards and visualizations via Tableau Server, Tableau Online, or Tableau Public.
4. ChatGPT
Developed by OpenAI, ChatGPT is an AI chatbot for data analysis that uses LLMs to view, understand, and analyze data. While it’s not a traditional AI analytics tool like Quadratic, ChatGPT performs satisfactorily in analyzing data, generating code to perform complex analysis, and facilitating interactive data exploration. It is best suited for analyzing small or medium datasets, as working with large datasets may result in truncated rows or slow processing.
The core functionality of leveraging ChatGPT for data analysis lies in using LLMs to get insights into your data. This makes it a suitable analytics platform for both technical and non-technical users, as it requires minimal technical expertise to maximize its benefits.
A major drawback of using ChatGPT for data analysis is that it cannot natively connect to live databases for visualization and other analysis, so users have to manually upload files from their computer. It also cannot create interactive visualizations; users have to pull their data out of ChatGPT and utilize a third-party data visualization software. Unlike Quadratic and other BI tools, ChatGPT is not a collaborative tool, so sharing insights and dashboards is not supported.
Features of ChatGPT
- Natural language querying: Users can ask questions about their data in plain English and gain insights.
- Code generation: ChatGPT is capable of generating Python code for tasks like data cleaning, data modeling, and statistical analysis, such as t-tests and ANOVA.
- File upload: ChatGPT supports CSV, Excel, JSON, and text files. Users can upload their data in common file formats and begin analysis instantly.
- Explanability: ChatGPT can serve as a learning tool for beginners as it’s capable of explaining the processes involved in the analysis of your data, including code samples, statistical methods, and final output.
5. Domo

Domo is a cloud-based analytics and business intelligence tool that supports data cleaning, modification, analysis, and visualization. It offers an intuitive interface that leverages AI for business intelligence and data exploration. It’s accessible across various devices, as users can also see updates to their data in real-time. Compared to other tools, Domo has limited advanced analytics. The cost may also be high for businesses looking only for data analysis.
Features of Domo
- Cloud-based: Domo is widely accessible as it operates completely on the cloud.
- AI data exploration: Users can leverage Domo’s built-in AI chat to explore data and get insights using natural language queries.
- AutoML: Domo offers AutoML capabilities, which allow users to build and deploy models with minimal coding expertise. It also comes with various pre-built models that users can integrate into their data for forecasting, anomaly detection, and sentiment analysis.
- Multiple data sources: Domo can connect to over 1,000 data sources with its built-in connectors.
Conclusion
As a data analyst, using AI for data analysis can dramatically accelerate your ability to uncover actionable insights and significantly enhance your productivity. Instead of spending hours on repetitive tasks, AI data analysis tools automate these processes, allowing you to focus on deeper analysis and making informed decisions.
In this blog post, we explored the 5 best AI tools for data analysis, their unique features, and how they help automate key parts of your workflow. The ideal AI tool for data analysis should be able to:
- Automate data cleaning
- Handle large datasets
- Offer automated insights using natural language querying
- Connect to multiple data sources
- Natively support coding
- Automatically create visualizations
- Provide a collaborative environment for seamlessly working in teams.
Quadratic is the only software for data analysis that satisfactorily ticks all these boxes, making it the best AI tool for data analysis. Try Quadratic for free today.