Tyler Von Harz, Community Partner
Aug 20, 2025

Finance teams face constant pressure to deliver fast, accurate insights in a volatile environment. As your data sources multiply and complexity grows, traditional tools you started out with often fall short. Sifting through spreadsheets or manually generating reports not only wastes time, it increases your risk of missing insights and making costly mistakes.
That’s where financial data analysis software comes in. Tools that combine real-time connectivity, AI support, and advanced modeling features can help eliminate blind spots and improve forecasting accuracy. In this article, we’ll break down the core financial data analytics techniques used in financial planning and analysis, then explore how AI tools like Quadratic are reshaping what’s possible.
What is financial data analysis?
Financial data analysis is the process of examining a company’s financial information to inform planning, budgeting, forecasting, and risk management decisions. It involves collecting data from key sources (general ledgers, income statements, balance sheets, and cash flow reports) and applying statistical, modeling, and visualization techniques to identify patterns, detect anomalies, and assess performance against financial goals.
This type of analysis often takes you a bit beyond surface-level reporting. It lets organizations evaluate profitability, monitor liquidity, forecast future revenue and expenses, and simulate different financial scenarios under changing market conditions. When done effectively, data analytics in finance become a foundational part of strategic decision-making, giving CFOs and finance teams the tools to allocate resources efficiently, identify risks early, and maintain fiscal discipline in dynamic environments.
Common techniques in financial data analytics
Cash flow forecasting

Cash flow forecasting involves projecting a company's future cash inflows and outflows to assess liquidity, operational health, and funding needs. Typically, it begins with historical financial statements (like net income, depreciation, working capital changes) and extends into future periods using trend analysis or assumptions such as sales growth or expense timing.
To build a structured forecast that supports scenario planning and short‑term planning, you segment your model into components: income from operations, changes in receivables/payables, and non-cash expenses. Accurate forecasting means you’ll need clean data, clear logic, and flexibility to adapt models to changing assumptions.
Traditional spreadsheet-based cash flow models often rely on complex nested formulas and manual linkages, increasing the risk of calculation errors or broken references. Dynamic forecasting also requires rapid re‑calculation when assumptions (like payment terms or revenue growth rates) are changed.
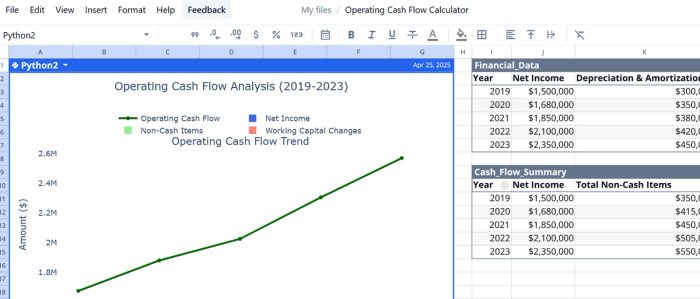
Quadratic’s templates, like its Operating Cash Flow Calculator, help you automate cash flow calculations and generate interactive visual dashboards based on your inputs. You can enter financial statement data and Quadratic computes each component – from net income to changes in working capital – and produces trend charts over a five-year period.
Because Quadratic runs Python-powered logic under the hood, formulas remain transparent and debuggable, while you benefit from dynamic updates as when you tweak inputs. It also connects directly to external systems, such as ERP, bank feed APIs, or accounting databases, so forecasts can refresh automatically without re-importing data.
Variance analysis (actuals vs. forecast)

Variance analysis is the financial analytics discipline of comparing actual results to forecasted figures (sales, expenses, or cash flow) to understand where performance diverged from expectations. This typically involves calculating both dollar and percentage variances (e.g., actual revenue vs. forecasted revenue) to flag favorable or unfavorable deviations.
Businesses use this insight to diagnose the causes, whether revenue shortfalls, unexpected costs, or inefficiencies, and inform corrective actions for budgeting, forecasting, and resource planning.
Consistent application of this practice is essential. It helps FP&A teams refine their assumptions over time, improving forecasting precision and strategic planning. Regular variance reporting (monthly or quarterly) enables prompt detection of outliers or unfavorable trends, fostering more agile decision-making. Without automation, however, this becomes time-intensive and prone to human error, as finance teams manually update models, reconcile actuals, and recast forecasts across multiple spreadsheets or systems.
Quadratic supports variance analysis by automating much of this process within its live, AI-enabled spreadsheet environment. Once you connect to financial sources, whether that be ERP systems or bank data, the system can auto-import actuals and align them against forecast drivers defined in your model.
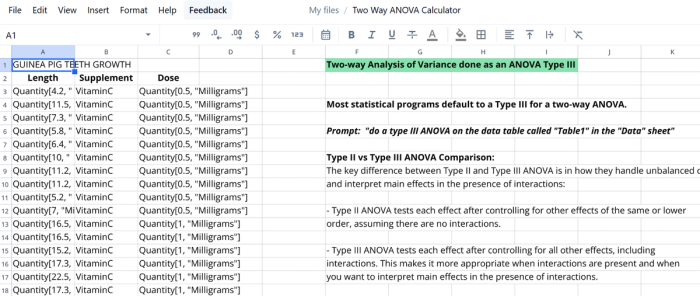
Using built-in Python or templated logic, Quadratic calculates variance metrics dynamically and surfaces them in charts or summary tables. For more advanced analysis, you can also use the platform to run two-way ANOVA or variance tests embedded in cells to segment drivers of variance by category or period (leveraging its two‑way ANOVA calculator template and inline Python engine).
Time series modeling
Time-series modeling is a technique used to forecast future values based on historical data collected over regular intervals like monthly revenue, daily cash balances, or quarterly expenses. In analytical finance, you will use it to project trends, assess seasonality, and make forward-looking decisions.
Data analytics techniques like exponential smoothing apply weighted averages to past observations, giving more importance to recent data, which is useful for short-term forecasting with minimal noise. More advanced techniques like ARIMA (Auto Regressive Integrated Moving Average) help you account for trends, lags, and differences in the data, making them well-suited for modeling longer-term financial patterns or correcting for autocorrelation (see an example of ARIMA in this energy usage prediction template).
Typically you will visualize the data first to identify trends or seasonality, then test for stationarity (whether the data’s statistical properties remain constant over time) before fitting a model. While powerful, financial time-series analysis can be complex without the right financial analytics tools. That’s why platforms that support built-in forecasting functions or in-cell scripting with Python and R — like Quadratic or Excel with the statsmodels package — are often very necessary for automating the process and maintaining forecast accuracy.
Scenario planning and “what-if” analysis

Scenario planning and what‑if analysis are strategic forecasting techniques that allow finance teams to assess the potential outcomes of business decisions or external pressures by altering key assumptions within financial models.
What‑if analysis typically tweaks a single variable — such as sales growth, cost of goods sold, or headcount — to see how the financial outcomes shift. In contrast, scenario planning builds multiple coherent storylines, often constructed as best-case, base-case, and worst-case scenarios, that reflect simultaneous changes in multiple variables. Together, these finance and business analytics methods help businesses anticipate a range of potential futures and prepare flexible responses.
In practice, this means finance teams can test the big questions like: “What if our pricing drops by 10% while customer churn increases?” or “How sensitive is our net profit to shifts in both sales volume and operating margins?” Finance analytics questions like these provide insight into which inputs matter most and how they interact, helping organizations identify risks or opportunities before they materialize. Modern FP&A software supports these explorations through scenario toggles, version-controlled model variants, and sensitivity analysis tools that reveal how changes affect overall outcomes.
Rolling forecasts and sensitivity models
Rolling forecasts and sensitivity models are two closely related data-driven financial analysis techniques worth mentioning together.
A rolling forecast continuously updates financial projections based on the most recent actuals, typically projecting 12 to 18 months ahead, regardless of the fiscal year. Instead of being locked into a static annual budget, rolling forecasts allow businesses to adjust assumptions (like revenue growth, expenses, or headcount) as new data becomes available. This helps you stay aligned with changing market conditions, internal performance, or economic shifts.
Sensitivity models, on the other hand, measure how sensitive a financial outcome is to changes in one or more inputs. Think things like net income, EBITDA, or cash runway. For example, how much would a 5% increase in supplier costs reduce margins? Or how does a 10% drop in revenue impact cash flow? Sensitivity analysis quantifies this risk by testing ranges or scenarios around key drivers, helping companies identify high-impact levers and avoid overexposure.
Combined, rolling forecasts and sensitivity models enable more flexible, data-driven planning. Instead of planning once a year and hoping reality matches the model, you can course-correct throughout the year, and understand the potential downside (or upside) if things don’t go as planned.
Using AI-powered financial data analysis tools are the key
A recent report shows that a staggering 65% of businesses are using AI to get ahead. And for good reason: they can rapidly accelerate data analysis and reduce manual work. Many of the best financial data analysis tools, such as Quadratic, include a built-in AI assistant capable of generating code, writing queries, creating data summaries, and suggesting transformations all from natural language prompts.
Quadratic lets you analyze data like a spreadsheet. The rows, columns, formulas you´re used to — but with the power of code baked in. You can run Python, SQL, and JavaScript right inside your cells. That means you're not stuck with clunky workarounds or weird formula hacks like in Google Sheets. You can clean messy data, build charts, run regressions, make API calls, and even train basic ML models without ever leaving the grid.
If you're looking for a flexible, modern solution that blends the simplicity of spreadsheets with the power of code and AI, find out why Quadratic is worth adding to your financial data analytics workflow.

