MJ Lindeman, PhD, Community Partner
May 6, 2025

Table of contents
- Understanding the data analysis spectrum
- Foundational basic data analysis techniques
- Intermediate statistical techniques for data analysis
- Advanced data analysis techniques
- Emerging advanced data analytics techniques
- Integrating different data analytics techniques
- Data analytics tools and techniques in practice
- Choosing the right data analysis technique
- The future of data analytics techniques
The ability to extract valuable insights from data has become a critical competitive advantage. Organizations that effectively leverage data analytics techniques make faster, more informed decisions that drive their growth and innovation. However, it can be difficult to choose the appropriate methodology to apply to the data, especially as new techniques continue to emerge.
This post explores the variety of techniques for data analysis, from foundational statistical methods to cutting-edge AI-powered approaches. We'll examine how modern tools like Quadratic AI are making sophisticated mathematical analytics available to users at all skill levels through intuitive interfaces and built-in AI spreadsheet assistance.
Understanding the data analysis spectrum
This set of data analytics techniques includes a broad range of methodologies, each suited to different types of data and analytical objectives. Effective analysts understand when and how to apply the various data analysis techniques to extract maximum value from their data.
Quantitative vs. qualitative analysis approaches
The methodologies can be described as either quantitative or qualitative. Data analysis techniques in quantitative research focus on numerical data and statistical methods. In contrast, qualitative data analysis techniques focus on non-numerical information like text, images, and observations.
Quantitative analysis enables precise measurement and comparison, producing results that can be readily visualized and communicated through charts and graphs. In contrast, qualitative analysis uncovers themes, patterns, and deeper meanings in unstructured data, providing rich context and nuance that complement and perhaps explain numerical findings.
The most comprehensive analytical projects often combine both approaches. For example, a customer satisfaction study might use surveys (quantitative) alongside interviews (qualitative) to develop a complete understanding of user experience. Modern analytics platforms like Quadratic AI support this integrated approach by providing tools for both numerical analysis and text processing within a single environment.
The methodologies can also be grouped into four categories: foundational, intermediate, advanced, and emerging. They are discussed in the following sections. These techniques are a sample, and there are numerous others.
Foundational basic data analysis techniques
It is essential to master the fundamentals first. These basic data analysis techniques form the building blocks of more sophisticated analyses and are valuable tools for any analyst to use.
1. Basic statistics
Basic statistics summarize and organize data to reveal basic patterns and characteristics. These methods include measures of central tendency (mean, median, mode), dispersion (range, variance, standard deviation), and distribution shape (skewness, kurtosis). While simple, these calculations provide critical insights into data quality, structure, and basic relationships.
In Quadratic, basic statistics can be generated through simple formulas, Python code, or AI-assisted commands. For example, you might ask the AI to "summarize the distribution of customer spending by region," and quickly receive statistical calculations and appropriate visualizations.
2. Data visualization
Data visualization software converts sets of numbers into intuitive, visually compelling representations that reveal patterns, trends, and relationships. Common visualization methods include bar charts for comparing categories, line charts for temporal trends, scatter plots for relationships between variables, and heat maps for displaying patterns across multiple dimensions.
It is easy to create effective visualizations in Quadratic with or without writing any code. You can use code libraries such as Plotly, spreadsheet formulas, or natural language requests to the AI assistant. This flexibility allows you to quickly explore data from different angles before deciding which visualization(s) to use.
For example, you can ask the AI to create a specific type of chart, and then tweak its appearance by using the code editor. This related Quadratic blog post illustrates 26 types of charts, and there are other types of charts not included in that post.
3. Correlation analysis
A correlation's r value (the Pearson correlation coefficient) measures the co-occurrence of two variables, such as birds’ beaks and wings. It identifies potential connections worth investigating further. While a correlation does not establish causation, it provides valuable insights into how variables move together and can guide hypothesis formation.
Conducting correlation analysis in Quadratic is straightforward, with built-in functions and software for data analysis that make it easy to identify and explore relationships. The AI assistant can help you interpret correlation coefficients by explaining the strength and direction of relationships in plain language.
Intermediate statistical techniques for data analysis
As analysts develop their skills, they typically move beyond basic methods to more sophisticated statistical approaches that provide deeper insights and support more complex decision-making.
1. Hypothesis testing
Hypothesis testing determines whether observed patterns represent genuine effects or a chance event. Common tests include t-tests for comparing means, chi-square tests for categorical data, and ANOVA for comparing multiple groups. These methods help you establish statistical significance and make data-backed claims with confidence.
In Quadratic, hypothesis tests can be conducted using Python's SciPy or statsmodels libraries, with the AI assistant helping to select appropriate tests, interpret results, and explain findings to stakeholders in accessible language. Here again, the AI embedded within the spreadsheet helps by suggesting tests and interpreting their results.
2. Regression analysis
Regression analysis examines relationships between dependent and independent variables, enabling prediction and identifying factors that influence outcomes. Linear regression models straightforward relationships, while more complex variations like multiple regression, polynomial regression, and logistic regression handle more sophisticated scenarios.
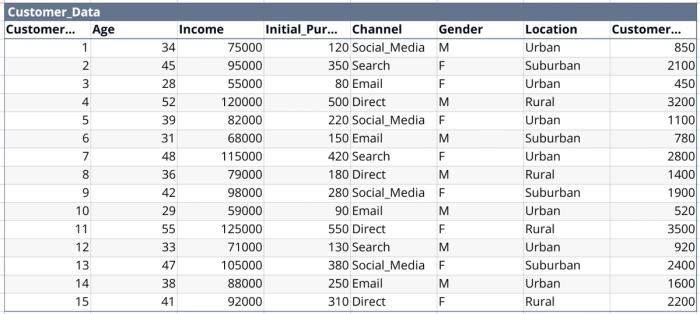
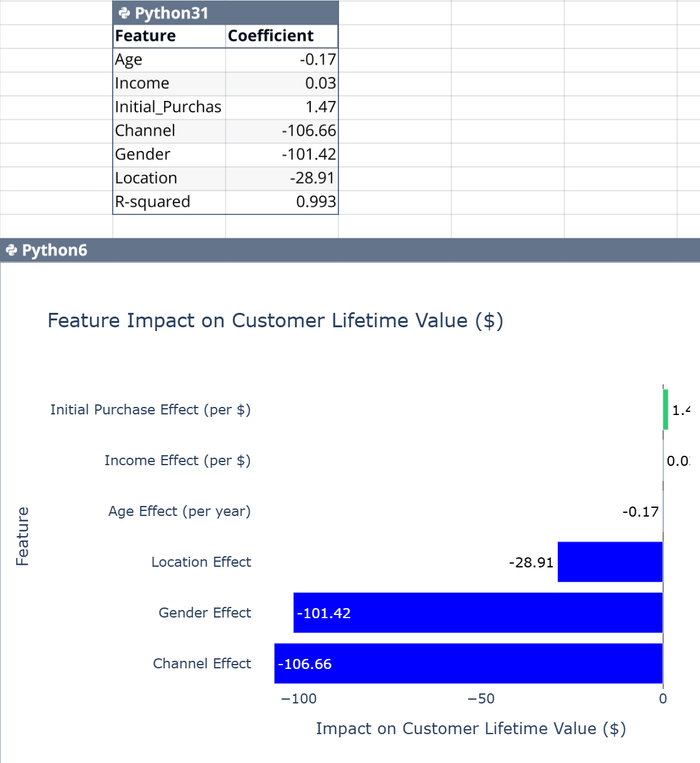
Quadratic supports regression analysis through code-based approaches and AI assistance. For example, I created the analysis in the following images with this one-sentence prompt: "Create a sample dataset and then build a multiple regression model predicting customer lifetime value based on acquisition channel, initial purchase value, and demographic factors."
As usual, Quadratic’s AI suggested additional analysis and other prompts. Additional one-sentence prompts and clicking on suggestions produced a line chart showing age vs lifetime customer value, a box chart showing lifetime value by location, a summary of the key findings, a marketing strategy, a retention strategy, and a three-tiered loyalty program design overview. Each of these took only seconds to display after being requested.
3. Time series analysis
Time series analysis examines data points collected at regular intervals, identifying patterns, cycles, and trends over time. Techniques include moving averages, exponential smoothing, and ARIMA (AutoRegressive Integrated Moving Average) models, all valuable for forecasting future values based on historical patterns.
Within Quadratic, time series analysis benefits from Python libraries like pandas and statsmodels, combined with interactive visualizations that allow you to explore temporal patterns from multiple perspectives. The AI assistant can help identify seasonal patterns, trends, and anomalies that might otherwise remain hidden.
Advanced data analysis techniques
As data volumes grow and business questions become more complex, analysts increasingly turn to advanced data analytics techniques that can uncover deeper insights and address more sophisticated problems.
1. Machine learning methods
Machine learning represents a powerful extension of traditional statistical approaches. Supervised learning develops predictive models based on labeled training data, unsupervised learning discovers patterns in unlabeled data, and reinforcement learning optimizes decisions through feedback loops.
Quadratic integrates seamlessly with popular machine learning libraries like scikit-learn, allowing you to build, test, and deploy models directly within your spreadsheets. The AI assistant can suggest appropriate algorithms based on data characteristics and analysis objectives, making machine learning more accessible to analysts without specialized training.
2. Natural language processing
Natural language processing (NLP) applies computational techniques to analyze and synthesize human language. Data analysis techniques in qualitative research increasingly leverage NLP to extract themes, sentiment, and insights from textual data like customer reviews, social media posts, and survey responses.
Quadratic's integrated Python environment supports popular NLP libraries, while its AI capabilities enable you to extract insights from text without writing complex code. For example, you might upload customer reviews and ask, "What are the main themes in negative feedback, and how have they changed over time?"
3. Network analysis
Network analysis examines relationships and interactions within complex systems, identifying key nodes, communities, and patterns of connection. This approach is valuable for understanding social networks, supply chains, communication patterns, and other interconnected systems.
In Quadratic, network analysis can be performed using Python libraries like NetworkX, with interactive visualizations that allow you to explore connections from multiple perspectives. The AI assistant can help identify central nodes, communities, and patterns that might indicate opportunities or risks.
4. Monte Carlo simulation
Monte Carlo simulation is a powerful data analytics technique that generates models of possible outcomes and their probability distributions. This computerized method helps analysts conduct advanced risk analysis by calculating the likelihood of different scenarios based on variable inputs.
In Quadratic, you can implement Monte Carlo simulations using Python's NumPy and Pandas libraries. The AI assistant can help structure simulations and interpret results, making this complex technique accessible even to analysts without extensive statistical backgrounds.
5. Factor analysis
Factor analysis reduces numerous variables to a smaller number of underlying factors, revealing hidden patterns in complex datasets. This technique is particularly valuable for exploring abstract concepts like customer satisfaction or brand loyalty by grouping correlated variables into meaningful factors.
Implementing factor analysis in Quadratic is straightforward with Python's scikit-learn and statsmodels libraries. The AI assistant can help interpret factor loadings and explain results in business-relevant terms that stakeholders can understand and act upon.
6. Cluster analysis
Cluster analysis sorts data points into groups (clusters) that are internally similar yet different from other clusters. This exploratory data analysis technique helps identify natural structures within datasets, making it invaluable for customer segmentation, anomaly detection, and pattern discovery.
Quadratic supports various clustering algorithms through Python libraries, with visualization capabilities that make cluster patterns immediately apparent. The AI assistant can suggest appropriate clustering methods based on data characteristics and analysis goals.
7. Cohort analysis
Cohort analysis groups users based on shared characteristics and tracks their behavior over time. This dynamic approach provides insights into the customer lifecycle, revealing how different customer segments behave at various stages of their journey.
In Quadratic, cohort analysis can be implemented through Python code or AI assistance, with visualizations that highlight retention patterns, conversion rates, and other key metrics across different cohorts. This helps organizations optimize their offerings and marketing strategies for specific customer segments.
8. Sentiment analysis (Text analysis)
Sentiment analysis interprets emotions conveyed in textual data, allowing organizations to understand how customers feel about their products or services. This qualitative data analysis technique uses natural language processing to categorize text as positive, negative, or neutral, with some models identifying specific emotions or aspects.
Quadratic supports sentiment analysis through Python's NLTK and spaCy libraries, with AI assistance that helps interpret results in business-relevant terms. This capability transforms unstructured customer feedback into actionable insights that drive product improvements and marketing strategies.
9. Dispersion analysis
Dispersion analysis helps you understand the variability within your data by measuring the distance of the data points from the mean. It is a valuable diagnostic tool for identifying outliers and assessing whether the data is consistent and relevant for the specific group or phenomenon you are studying. A tight spread (low dispersion) often indicates more consistent and potentially more relevant data for a specific segment. In contrast, a wide spread (high dispersion) might signal the presence of outliers or the need for further segmentation.
Emerging advanced data analytics techniques
The data analysis field continues to evolve rapidly, with several leading-edge approaches being used in forward-thinking organizations.
1. Deep learning
Deep learning uses neural networks with multiple layers to model complex patterns in large datasets. These techniques have transformed fields like computer vision, natural language processing, and predictive analytics, enabling previously impossible analyses.
While traditionally requiring specialized expertise, tools are making deep learning more accessible by providing simplified interfaces and AI guidance for building and interpreting neural network models.
2. Reinforcement learning
Reinforcement learning optimizes decision-making through trial and error, with algorithms learning from the consequences of their actions. This approach is particularly valuable for sequential decision problems like resource allocation, pricing strategies, and portfolio management.
3. Explainable AI
As AI models become more complex, understanding their decision-making becomes increasingly important. Explainable AI techniques help you interpret model behavior, identify potential biases, and communicate findings to stakeholders with confidence.
Integrating different data analytics techniques
The best data analysis techniques are not used in isolation but combined strategically to address complex business questions from multiple points of view. By integrating diverse approaches, you can develop more robust insights and minimize the limitations of any single methodology.
1. Multi-method approaches
Effective analysts select and combine techniques based on the specific question at hand, the available data, and the required confidence level. For example, a customer churn analysis might combine descriptive statistics to understand baseline metrics, regression to identify risk factors, and machine learning to build predictive models.
Quadratic supports this integrated approach by providing a unified environment where you can seamlessly switch between methods. The AI assistant can recommend appropriate combinations based on your objectives and data characteristics.
2. Iterative analysis
Data analysis is rarely a linear process. Instead, analysts typically cycle through exploration, testing, refinement, and validation as they develop insights. Each iteration builds on previous findings, gradually converging on robust conclusions that can guide business decisions.
With its spreadsheet-like interface and code integration, Quadratic naturally supports this iterative workflow. You can quickly test hypotheses, visualize results, and refine your approach based on emerging patterns, all within a single, collaborative environment.
3. Triangulation
Triangulation applies multiple analytical techniques to the same question, increasing confidence in findings that appear consistent across different approaches. This methodology is particularly valuable when dealing with complex or high-stakes decisions.
In Quadratic, triangulation is straightforward, with the ability to analyze the same dataset from multiple perspectives simultaneously. The AI assistant can help identify convergent and divergent findings, providing a more nuanced understanding of the underlying phenomena.
Data analytics tools and techniques in practice
The effectiveness of any analytical technique depends heavily on the tools used to implement it. Modern data analysis tools and techniques are increasingly integrated, with platforms offering comprehensive capabilities across a variety of possible analyses.
1. Integrated analytics platforms
Integrated platforms like Quadratic combine multiple capabilities within a unified environment, eliminating the need to switch between specialized tools. By bringing together spreadsheet functionality, programming capabilities, visualization tools, and AI assistance, these platforms streamline the analytical workflow and make sophisticated techniques more accessible.
For example, when using Quadratic, you might begin with exploratory data analysis using spreadsheet-like functions, develop statistical models using Python code, create interactive visualizations with Plotly, and generate narrative insights with AI assistance. You can do all of this within a single, collaborative environment.
2. Real-time analytics
As business environments become more dynamic, the ability to analyze data in real-time has become increasingly valuable. Real-time analytics enables organizations to identify and respond to emerging trends, opportunities, and risks as they develop, rather than relying on historical analyses alone.
Quadratic supports real-time analytics through direct database connections and API integrations. You can create dashboards that update on-demand, providing stakeholders with current insights that drive timely decisions with database analytics.
3. Collaborative analytics
Modern analytics increasingly involves cross-functional teams working together to address complex business questions. Collaborative platforms enable multiple stakeholders to contribute their expertise, building on each other's insights and developing a shared understanding of the data.
Quadratic's collaborative features support this approach, allowing teams to work together in real-time, share analyses, and leverage each other's expertise. The AI assistant can help bridge knowledge gaps between technical and non-technical team members, ensuring that everyone can contribute effectively.
Choosing the right data analysis technique
With so many analytical approaches available, selecting the most appropriate technique for a specific situation can be difficult. The AI can help you choose. For example, for the dataset illustrated earlier, I prompted "pick the best type of chart for explaining the largest key finding and put it in F56". It recreated the chart it had automatically produced in response to my request for an example dataset with an analysis.
When you are choosing which technique to use, several factors should guide your choice:
1. Problem type
The nature of the problem being addressed is perhaps the most important consideration. Each problem type aligns with different analytical approaches. Descriptive problems focus on understanding what happened, diagnostic problems investigate why it happened, predictive problems forecast what might happen next, and prescriptive problems determine what actions to take.
For example, descriptive problems might rely on statistical summaries and visualizations, while predictive problems typically involve machine learning models. Quadratic's AI assistant can help identify the most appropriate techniques based on the specific question being addressed.
2. Data characteristics
The structure, size, and quality of available data significantly influence technique selection. Structured data often lends itself to statistical and machine learning approaches, while unstructured data might require text analysis, image processing, or other specialized techniques.
Similarly, large datasets might benefit from techniques designed for scale, like gradient boosting or deep learning, while smaller datasets might be better served by traditional statistical methods. Quadratic AI can help you assess the data characteristics and select appropriate techniques accordingly.
3. Resource constraints
Practical considerations like available time, computational resources, and team expertise also influence technique selection. Some advanced methods require significant computing power or specialized knowledge, while others can be implemented quickly with minimal resources.
Quadratic addresses these constraints by making sophisticated techniques more accessible through AI assistance and an intuitive interface. This democratization of data analysis enables organizations to leverage advanced analytics regardless of their technical resources.
The future of data analytics techniques
The available data analytics techniques will continue to evolve, and two trends are likely to shape this evolution:
- Increased automation will streamline routine analytical tasks, allowing you to focus on interpretation and strategic implications rather than technical implementation. AI assistance will become more sophisticated, providing guidance not just on how to analyze data but on what questions to ask and what actions to take based on the results.
- Integration across multiple analytic techniques will continue, with techniques from different traditions combining to address complex, multifaceted problems. The boundaries between quantitative and qualitative approaches, between statistical and machine learning methods, and between descriptive and predictive analytics will become increasingly blurred.
Through all these changes, the fundamental data analytics strategy will remain constant: transforming raw information into actionable insights that drive better decisions. By mastering a diverse toolkit of analytical techniques and leveraging modern platforms like Quadratic, you can extract maximum value from your data and contribute directly to organizational success.
Ready to explore how Quadratic can enhance your analytical capabilities? Try it today and experience how the combination of spreadsheet functionality, programming flexibility, and AI assistance can transform your approach to data analysis.