
MJ Lindeman, PhD, Community Partner
May 29, 2025

Table of contents
- What is a t-test?
- When should you use a t-test?
- Types of t-tests
- T-test assumptions
- Real-world example: Analyzing sales data with t-tests
- When to use ANOVA instead of t-tests
- Performing t-tests with modern tools
- Example: Paired t-test in Quadratic
- Interpreting t-test results
- Conclusion: Mastering t-tests for better decision-making
Do you find yourself staring at datasets, unsure whether the differences you see are meaningful or just random fluctuations? T-tests provide the statistical foundation you need to make data-driven decisions with confidence. For example, use a t-test when you are comparing the effectiveness of two marketing campaigns, or analyzing before-and-after treatment results, or evaluating if a new process outperforms the current one.
In this post, we'll explore what a t-test is, when to use the different types of t-tests, and how to interpret the results. We'll walk through real-world examples using actual data and show how modern AI tools for data analysis like Quadratic AI make conducting these analyses more accessible than ever before.
What is a t-test?
A t-test is a statistical hypothesis test used to determine if there is a significant difference between the means of two groups. Developed by William Sealy Gosset (who published under the pseudonym "Student"), the Student t-test helps you assess whether observed differences are statistically meaningful or simply due to random chance.
The core concept behind a t-test is straightforward. You compare the observed difference between group means against the difference you would expect by random chance alone. If the observed difference is sufficiently large relative to the value for random chance, then it is safe to conclude that the difference is statistically significant.
There are two types of t tests: one-tailed and two-tailed. The difference is whether you care about the direction of the difference. If you want to know if there is a difference in any direction, use the two-tailed t-test. On the other hand, if you are interested in a specific direction, use the one-tailed test. The table below compares the two types of t tests.
| Feature | One-tailed test | Two-tailed test |
|---|---|---|
| Direction of interest | Specific direction | Either direction |
| Alternative hypothesis | Specifies direction | No direction specified |
| Critical region | One tail | Both tails |
| Power | Higher for a specific direction | Lower, but detects effects in both directions |
| When to use | Strong prior direction belief | Any difference is of interest |
When should you use a t-test?
A t-test is the appropriate choice when:
- You're comparing means (averages) between groups
- Your dependent variable is continuous (measured on an interval or ratio scale)
- Your sample size is relatively small (typically less than 30)
- You want to determine if the differences between groups are statistically significant
While a z-test serves a similar purpose, understanding the t-test vs z-test distinction is important. A z-test requires knowing the population standard deviation and is typically used with larger samples, whereas a t-test uses the sample standard deviation and is more appropriate for smaller sample sizes.
Types of t-tests
There are several types of t-tests, each designed for specific research scenarios:
1. One-sample t-test
The one-sample t-test compares the mean of a single group against a known or hypothesized population value. This test asks: "Is our sample mean significantly different from some reference value?"
Example scenario: A manufacturer claims their light bulbs last 1000 hours on average. You test 25 bulbs and want to determine if their actual lifespan differs from the claimed value.
2. Independent samples t-test
Also known as the two sample t-test, the independent samples t-test compares means between two unrelated groups. This test answers: "Is there a significant difference between the means of these two separate groups?"
Example scenario: Comparing the average test scores of students taught using two different teaching methods, where each student experienced only one method.
3. Paired t-test
The paired t-test compares means between two related groups, typically the same group measured at different times or under different conditions. This test addresses: "Is there a significant change in our measurements before and after some intervention?"
Example scenario: Measuring patients' blood pressure before and after administering a medication to determine if the medication has a significant effect.
Understanding when to use a paired t-test versus an independent samples t-test is crucial for valid statistical analysis. The key distinction in paired vs unpaired t-test is whether your data values in the two groups are naturally paired or independent of each other.
T-test assumptions
For a t-test to provide valid results, several t-test assumptions must be met:
1. Independence: Observations within and between samples should be independent (except for paired t-tests, where pairs are related).
2. Normal distribution: The data should be approximately normally distributed. This assumption becomes less critical with larger sample sizes due to the Central Limit Theorem.
3. Homogeneity of variances: For independent samples t-tests, the variances between groups should be approximately equal (though modern variations like Welch's t-test can adjust for unequal variances).
4. Absence of outliers: There should not be any extreme values that distort the results.
Violating these assumptions may lead to inaccurate results, making it essential to check them before proceeding with your analysis.
Real-world example: Analyzing sales data with t-tests
Let's walk through a practical example of using a t-test for business data analysis. Imagine a company using an A/B test calculator to test two different promotional strategies (A and B) across 20 retail locations. After the promotion period, they want to determine if Strategy B generated significantly higher sales than Strategy A.
Here's a sample of their data:
| Store | Strategy | Sales Increase ($) |
|---|---|---|
| 1 | A | 1250 |
| 2 | A | 1400 |
| 3 | A | 1100 |
| 4 | A | 950 |
| 5 | A | 1300 |
| 6 | A | 1150 |
| 7 | A | 1050 |
| 8 | A | 1200 |
| 9 | A | 1350 |
| 10 | A | 1175 |
| 11 | B | 1450 |
| 12 | B | 1600 |
| 13 | B | 1350 |
| 14 | B | 1250 |
| 15 | B | 1500 |
| 16 | B | 1400 |
| 17 | B | 1300 |
| 18 | B | 1550 |
| 19 | B | 1650 |
| 20 | B | 1475 |
To determine if Strategy B is significantly more effective than Strategy A, we'll perform an independent samples t-test.
Import your data table into Quadratic for the analysis. If you paste in the data as text, you can ask the AI to convert the textual information to a numeric data table. Always check the AI’s output data table carefully to verify that the correct data set is being analyzed.
Then use the AI assistant to analyze the results. For example, you might prompt:
"Perform an independent samples two-tailed t-test to compare sales increases between Strategy A and Strategy B. Include descriptive statistics, the t-statistic, p-value, and interpretation of the results."
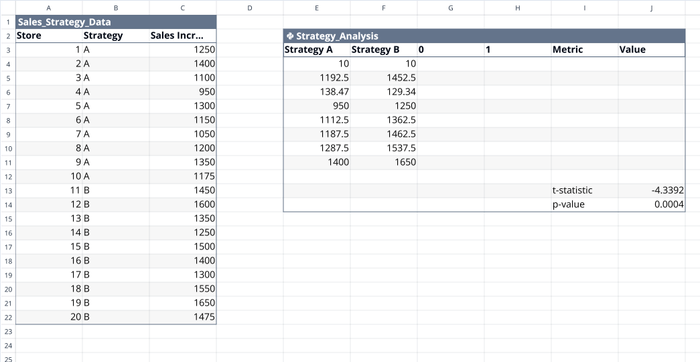
The AI would then calculate the group values and the T-test results. For the example, the t-statistic is -4.3392, with 18 degrees of freedom and p-value = 0.0004. The mean difference of $1,452.50 - $1,192.5 = $260 is significant.
Interpretation: There is a statistically significant difference between the two strategies, with Strategy B showing a significantly higher sales increase than Strategy A (p < 0.05). The mean difference of $260 represents a substantial improvement in sales performance.
When to use ANOVA instead of t-tests
While t-tests are powerful for comparing two groups, there are situations where other statistical tests are more appropriate. Understanding the t-test or ANOVA is important for effective data analysis.
The key difference in ANOVA test vs t-test is that Analysis of Variance (ANOVA) allows you to compare more than two groups simultaneously. If you're comparing three or more groups, using multiple t-tests would increase the probability of Type I errors (false positives). In such cases, ANOVA is the preferred approach.
Performing t-tests with modern tools
While you can certainly calculate t-tests manually, modern software for data analysis makes the process much more efficient. Let's explore a few options:
T-test calculator
Online t-test calculator tools provide a quick way to perform basic t-tests without specialized software. These tools typically require inputting your raw data or summary statistics, and they automatically compute the t-value, degrees of freedom, and p-value.
Traditional spreadsheets
For example, a t test can be done in Microsoft Excel by using the Data Analysis ToolPak. This requires installing and enabling the Analysis ToolPak if it is not already available in Excel.
T-test in Quadratic: The modern approach
Quadratic AI provides a powerful yet user-friendly environment for performing t-tests and other statistical analyses. Quadratic combines the familiar interface of a spreadsheet with advanced statistical capabilities and AI assistance, and can easily be used as a t-test spreadsheet tool.
Here's how you can perform a t-test in Quadratic:
- Import your data via CSV upload or direct entry (pasting in data was discussed earlier)
- Select the relevant cells containing your data
- Ask the AI assistant to perform the appropriate t-test (see the example prompts)
- Request visualizations to illustrate your findings
- Share your analysis with colleagues for real-time collaboration
The advantage of using Quadratic as your t-test tool is that you can perform the analysis, create visualizations, and document your findings all in one place. The platform's AI assistant can help you interpret results and check if your data meets the necessary assumptions, all without writing a single line of code.
Example: Paired t-test in Quadratic
Let's walk through a real-world example of performing a paired t-test in Quadratic for HR data analytics. Imagine we're analyzing the effectiveness of a training program by measuring employees' performance scores before and after the training.
First, we'd import our data into Quadratic:
| Employee | Before Training | After Training |
|---|---|---|
| 1 | 72 | 79 |
| 2 | 68 | 73 |
| 3 | 74 | 82 |
| 4 | 77 | 81 |
| 5 | 82 | 88 |
| 6 | 80 | 68 |
| 7 | 75 | 83 |
| 8 | 85 | 91 |
| 9 | 69 | 75 |
| 10 | 71 | 78 |
After selecting the data, you would prompt the AI assistant:
"Perform a two-tailed paired t-test on this data to determine if there's a significant difference in performance scores before and after training. Include descriptive statistics, the t-statistic, the critical value, degrees of freedom, p-value, and effect size. Also, create visualizations to show the difference."
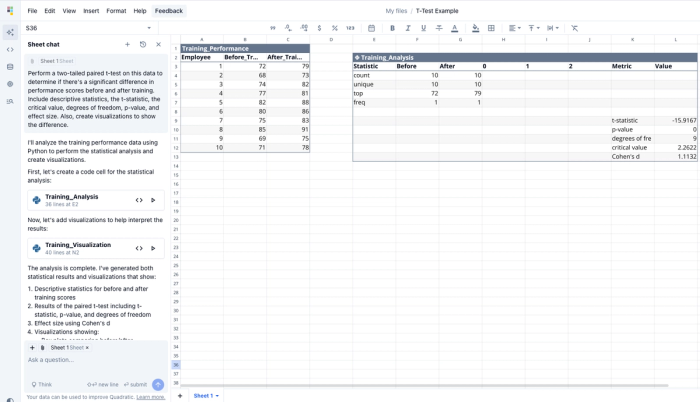
The AI would generate complete results that show the value of the t-statistic is significantly above the critical value of 2.2622 with nine degrees of freedom and p-value = 0.00.
Interpretation: There is a statistically significant improvement in performance scores after the training program. The large effect size indicates that this improvement is not only statistically significant but also practically meaningful.
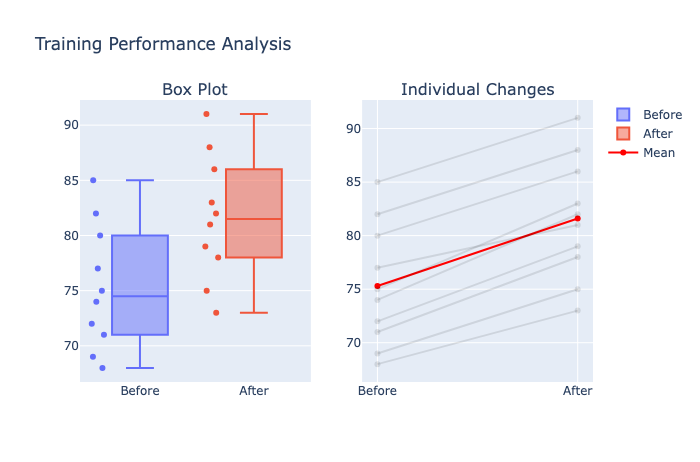
The AI could also create visualizations showing:
- A boxplot comparing the distributions before and after training
- A line graph showing individual changes for each employee
- A bar graph of the mean scores before and after training
This comprehensive analysis, performed without coding, provides all the information needed to evaluate the effectiveness of the training program.
Interpreting t-test results
Understanding your t-test results involves examining several key elements:
- T-statistic: The calculated t-value indicates how many standard errors the difference between means is from zero. Larger absolute values suggest stronger evidence against the null hypothesis.
- P-value: This represents the probability of observing a difference as extreme as (or more extreme than) what was observed if the null hypothesis were true. Typically, a p-value less than 0.05 is considered statistically significant, which you can easily compute with a p value calculator.
- Confidence Intervals: These provide a range within which the true difference between means is likely to fall, given your specified confidence level (typically 95%).
- Effect Size: Beyond statistical significance, effect size measures how meaningful the difference is in practical terms. Common effect size measures include Cohen's d and Hedges' g.
Remember that statistical significance does not necessarily imply practical significance. A very small difference might be statistically significant with a large enough sample size, but it may not be meaningful in a real-world context.
Conclusion: Mastering t-tests for better decision-making
T-tests are powerful statistical tools that help you determine whether observed differences between groups are statistically significant or merely due to chance. By understanding the different types of t-tests, checking the necessary t-test assumptions, and using the right tool for your analysis, you can make more informed, data-driven decisions.
Modern platforms like Quadratic AI make performing t-tests more accessible than ever before, allowing you to:
- Quickly analyze your data using AI assistance without coding
- Create compelling visualizations to communicate your findings
- Collaborate with team members in real-time
- Document your methodology and results all in one place
Whether you're using a simple online t-test calculator, learning how to perform t-test in Excel, or leveraging more advanced tools like Quadratic, Ready to put your new knowledge into practice? Try analyzing your own data with a t-test in Quadratic today and experience how modern tools can transform your statistical analysis workflow.