James Amoo, Community Partner
Jan 30, 2025

Choosing the right data analytics platform is crucial for unlocking maximum value from your data and generating actionable insights. Businesses increasingly rely on business intelligence (BI) tools to empower teams with self-service analytics to enable data-driven decision-making. While Power BI and Tableau are industry leaders in data visualization and BI, they come with their own set of limitations that may prompt organizations to seek alternatives.
Factors like pricing, compatibility across operating systems, scalability for large datasets, and integration with diverse data sources often drive users to explore other options. For example, smaller organizations may prefer a more budget-friendly tool that is less complex than Tableau, as its steep learning curve can be a barrier for beginners. Similarly, Power BI's performance challenges with large datasets may encourage users to look for a faster and more efficient solution for their analytics needs.
This blog post will explore several alternatives to Power BI and Tableau. These alternatives offer comparable capabilities and may better align with your organization’s unique requirements, whether you’re seeking cost-effectiveness, ease of use, or enhanced performance. We will also explore how Quadratic, the AI-powered spreadsheet, stands out as a compelling alternative to Power BI and Tableau.
Power BI vs Tableau: why you should consider alternatives
Power BI and Tableau are undoubtedly two of the most popular business intelligence tools available today. They both offer a wide range of visualizations, connections to diverse data sources, and efficient ways to transform raw data into actionable insights.
While these tools are great to use, choosing the best one for your organization depends on specific needs and use cases. In some situations, Power BI or Tableau might not be the ideal solution, and exploring alternatives—such as tools discussed in this blog post—could be advantageous.
Organizations often seek alternatives to Power BI due to its limited support for non-Windows operating systems, poor performance with large datasets, and lack of advanced analytics capabilities. Similarly, Tableau alternatives are considered because of its high cost and relatively steep learning curve.
Therefore, it is highly beneficial that individuals and organizations are enlightened on Tableau vs Power BI and their alternatives, as they offer significant benefits in terms of cost, cross-platform compatibility, performance with large datasets, and ease of use.
Quadratic
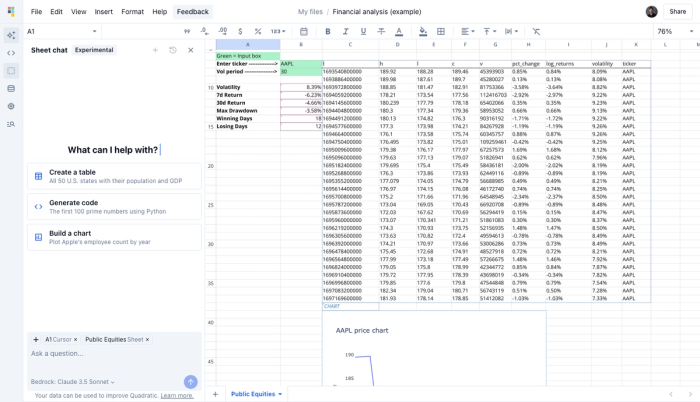
Quadratic is a browser-based, AI-powered spreadsheet that streamlines data visualization and business intelligence for organizations. Unlike Power BI and Tableau, which often require integrating multiple tools to achieve a comprehensive workflow, Quadratic is a centralized platform for viewing, manipulating, and visualizing data. By eliminating the need to juggle multiple BI tools and notebooks, Quadratic accelerates the journey from raw data to actionable insights, saving time and increasing efficiency.
One of Quadratic's standout features is its ability to handle large datasets seamlessly without the performance challenges plaguing other tools. This makes it an ideal choice for users or organizations that frequently work with extensive and complex data.
Quadratic also offers native support for Python, SQL, and JavaScript, making it flexible as an IDE for data analysis. It’s well suited to users of varying skill sets and built to meet the needs of diverse teams.
Why you should consider Quadratic
- Centralized location for multiple actions: By consolidating data viewing, manipulation, and visualization, Quadratic allows you to focus on actually generating insights and makes it easier for organizations to adopt a data-driven culture.
- Built-in AI support: Quadratic integrates AI into its interface, enabling users to extract insights, generate code, and perform advanced analyses using natural language queries. With built-in support for Python, SQL, and JavaScript, Quadratic makes AI-driven code generation seamless and more tailored to your data, unlike tools where code or AI features are external add-ons. Instead of black-box answers, Quadratic provides code that you can review, adapt, and build upon. This allows for a deeper understanding of your data and continuous improvement.
- Collaboration: Quadratic provides a collaborative environment where teams can collaborate in real-time, with each member able to make edits simultaneously. Tools like Power BI and Tableau may require additional configurations to achieve this.
- Multiple data sources: Quadratic enables seamless connections to raw data, databases, and APIs, allowing you to import and consolidate data from multiple sources in a single platform. Unlike Power BI, which primarily focuses on Microsoft-related data sources, Quadratic provides broader integration capabilities and flexibility, making it a good Power BI alternative.
- Support for modern coding languages: Alongside traditional spreadsheet formulas, Quadratic supports modern programming languages, allowing users with varying skill levels to perform a wide range of operations. This coding spreadsheet allows both non-technical citizen developers and technical users to perform last-mile analytics without any drawbacks.
Yellowfin BI
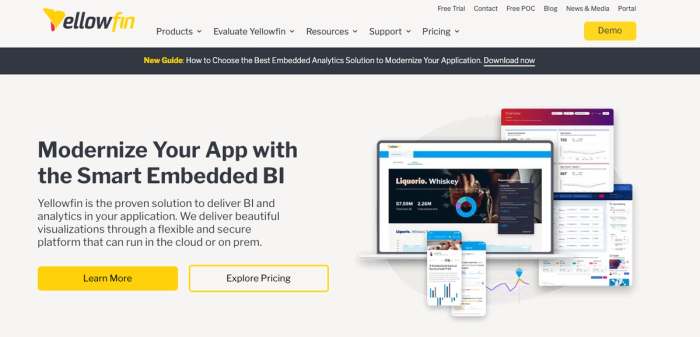
Yellowfin BI is a powerful, enterprise-grade Business Intelligence (BI) and analytics platform that empowers organizations to explore, understand, and act on their data, unlike traditional tools that focus solely on dashboarding or reports. Yellowfin BI provides a complete suite of features for data visualizations, data storytelling, and advanced reporting. It empowers businesses to make dynamic, insight-driven decisions through a unified platform.
Yellowfin BI is built for both embedded analytics and enterprise deployment, offering seamless integration into SaaS products and internal systems. With support for a wide range of data sources, modern data transformation capabilities, and strong governance controls, Yellowfin BI helps teams manage complexity and scale analytics across the organization without friction.
Why you should consider Yellowfin BI
- Data visualizations and reporting: Create interactive dashboards and detailed reports to track KPIs in real time, with tools that are easy for both technical and non-technical users.
- Augmented insights with automation: AI-powered features like Signals automatically detect anomalies and trends, while Broadcast ensures timely delivery of reports to stakeholders.
- Collaborative BI and storytelling: Collaborate in-platform with comments and annotations, and use storytelling tools to add context to your data and align teams.
- Embedded analytics at scale: Easily embed customizable, white-labeled analytics into any application using flexible APIs and architecture.
- Governance and data transformation: Ensure data integrity with strong governance, and transform raw data into analysis-ready formats within the platform.
Qlik Sense
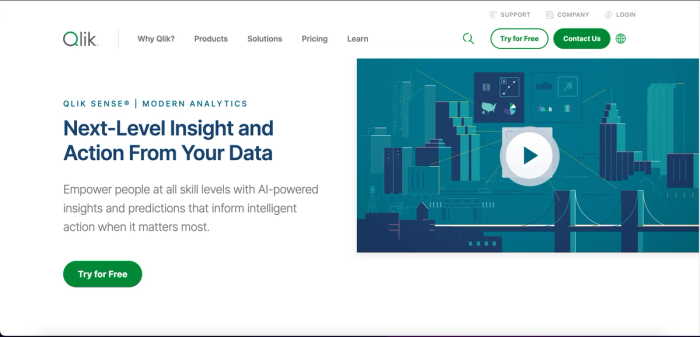
Qlik Sense is a business intelligence and data analytics platform designed to reveal hidden insights in your data using its innovative associative engine and AI-driven features. It offers advanced data visualization software and enables seamless access to your data from any internet-connected device. With Qlik Sense, users can harness AI-generated insights, collaborate effortlessly with team members, and create customized, dynamic reports tailored to their needs.
Why you should consider Qlik Sense
- Associative model: Qlik’s unique associative model enables you to uncover hidden relationships in your data that Power BI might miss due to its more structured approach.
- Interactive dashboards: Qlik allows you to create and interact with dashboards that respond instantly to user input.
- AI recommendations: Built-in AI features like the Insight Advisor in Qlik Sense allow you to effortlessly automate data analysis, identify outliers, and gain actionable insights.
- Data sources: Qlik Sense connects directly to a wide range of data sources, including databases and APIs.
- Customization: Qlik Sense offers extensive customization options for your charts and visualizations. While Tableau also excels in customization flexibility, Power BI falls short in this aspect.
Looker
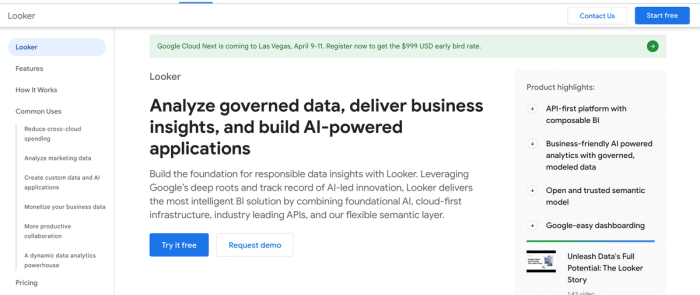
Looker is a web-based business intelligence tool that focuses on data exploration by allowing users to build interactive dashboards and create informative reports. It’s one of the most powerful Power BI alternatives, offering a unified view of your data and allowing you to explore and analyze findings. It also offers a collaborative environment where teams share findings. Looker integrates seamlessly with Google Cloud Platform and other cloud databases. Discover the best Looker Studio alternatives.
Why you should consider Looker
- Data modeling: It offers a modeling language, LookML, which enables users to define data models and important business metrics.
- Data exploration: With Looker, users can perform real-time data exploration and generate reports without relying on pre-defined datasets.
- Customization: Looker offers an extensive library of visualization tools, allowing users to design interactive dashboards, charts, and graphs tailored to their specific needs.
- Integration: Looker connects directly with databases without requiring additional configurations to your data.
Domo
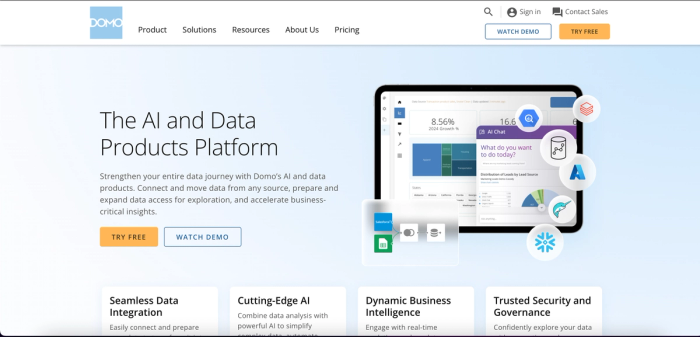
Domo is a cloud-based platform with a friendly interface that provides a wide range of helpful features for data analytics, visualization, and business intelligence. It collects data from multiple sources, converts it to a visual representation, and allows real-time collaboration on that data.
Why you should consider Domo
- Cloud-based: Domo operates completely on the cloud, making it easily accessible.
- Extensive visualization options: With over 150 chart types, Domo provides an extensive range of data visualization options, allowing users to present their data in the most meaningful way.
- User-friendly interface: Domo provides a platform friendlier than Power BI and Tableau, allowing users to get started with their data effortlessly.
- Multiple integrations: As a cloud-native solution, Domo connects directly to over 1,000 data sources, including databases, spreadsheets, and cloud applications. While Power BI and Tableau also support various data integrations, Domo offers superior options.
Sisense

Sisense is known for its ability to handle large datasets and perform complex analysis, making it one of the best alternatives to Power BI and Tableau. Similar to Domo, it combines data from multiple sources into a unified view. Its friendly interface allows users with little technical knowledge to create dashboards and reports. Like Quadratic, it offers AI-driven analytics that enables users to get quick insights into their data. Sisense also offers advanced AI and machine learning features to deliver insights on data.
Why you should consider Sisense
- Ability to handle large datasets: Sisense is an ideal choice for users needing to handle and visualize large datasets.
- Instant data analysis: Sisense connects directly to data sources and analyzes the data instantly.
- Scalability: Sisense's efficient in-chip processing ensures optimal performance, making it a good choice for large businesses and organizations.
- Integration with Git: Sisense simplifies version control with native Git integration, a feature not natively supported by Power BI or Tableau.
Zoho Analytics
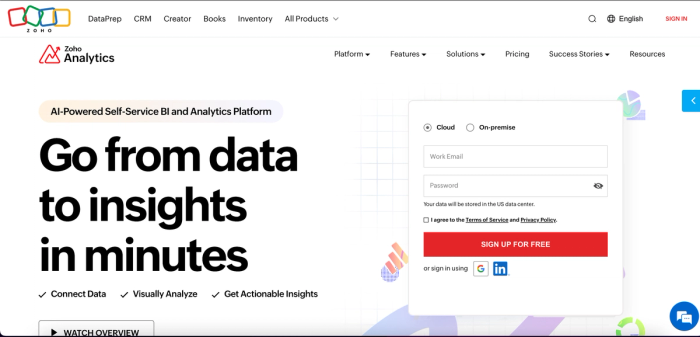
Zoho Analytics is a cloud-based platform that specializes in data analytics, data visualization, and business intelligence. Zoho Analytics is a tool that integrates seamlessly into the Zoho ecosystem of business applications. It’s relatively easy to learn and use, providing a drag-and-drop interface that streamlines building interactive dashboards and reports. You can also install the desktop version as an application, which is compatible with macOS, Windows, and Linux.
Why you should consider Zoho Analytics
- Data processing: Zoho Analytics offers an AI-powered feature that helps in data preparation, data cleaning, and blending, allowing users to enrich data for deeper analysis.
- Integration: With seamless connectivity to over 250 data sources, including other Zoho products, Zoho Analytics allows users to import and visualize data from multiple platforms easily.
- Friendly interface: Zoho’s drag-and-drop functionality makes it easy to build dashboards and gain insights. It also offers personalized widgets that cater to specific data needs.
- Automated data analysis: Data automation software features allow Zoho Analytics to automatically generate dashboards and reports when users select a specific data set.
Mode
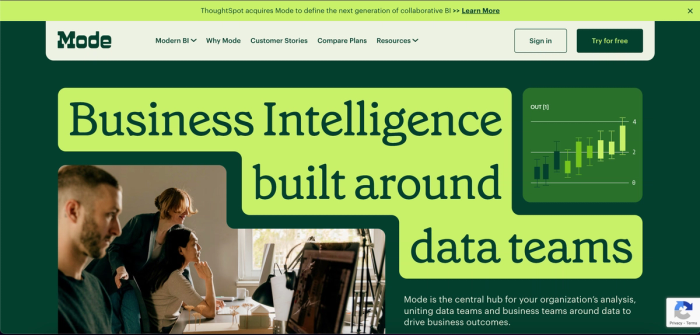
Mode streamlines data analysis and business intelligence by integrating SQL to generate even more meaningful insights. It comes with a built-in SQL editor, R, and Python notebooks. Mode provides an easy-to-use interface that fosters teamwork and collaboration. Users can leverage Mode’s SQL analytics feature to create reports and charts.
Why you should consider Mode
- Integrated SQL editor: Like Quadratic's native support for modern programming languages, Mode offers a cloud-based SQL editor, enabling users to build and execute queries easily.
- Python and R notebooks: Mode's support for Python and R scripts makes it well-suited for advanced data analysis, statistical analysis, and machine learning tasks.
- Multiple data sources: Mode connects to multiple data sources, including databases, data warehouses, and cloud-based storage.
- Extensive customization: Mode provides extensive customization options for data visualizations, offering a wider range of chart and graph types compared to Power BI and Tableau.
Conclusion
This blog post explores several alternatives to Power BI and Tableau, each offering unique features to enhance data visualization and business intelligence. Choosing the best tool ultimately depends on the scale of your project and your organization's specific needs. Next, determine the best alternative to Excel and alternative to Google Sheets.