Your AI Stock Market Data Analyst
Analyze portfolios, compare fundamentals, and test technical setups with real market data in a familiar spreadsheet. Ask in plain English, generate Python automatically, and move from question to analysis without switching tools.
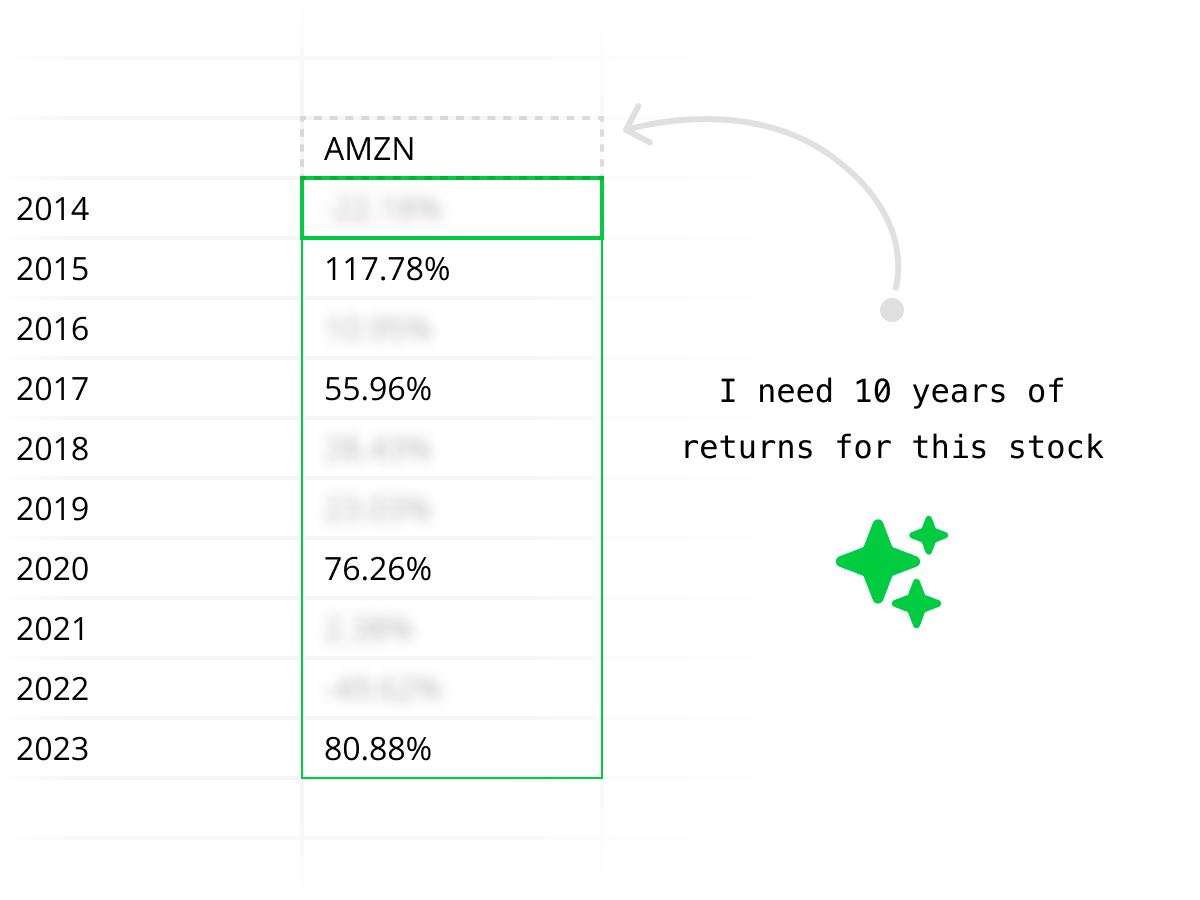
1Prompt suggestions
"I use Quadratic every day for macro analysis. It's replaced so many other tools and given me a leg up in terms of speed and efficiency. The APIs let me pull real time data to help make decisions quickly."
Max Gnesi — Head of Fixed Income Fund Selection, UBS
Explore every kind of market data
From historical prices to live quotes, financials to macro — all the market data you need, directly in your spreadsheet.
Historical stock prices
Pull daily, weekly, or intraday OHLCV data for any publicly traded stock. Backtest strategies, compare tickers, and analyze price trends over any time horizon.
| # | Date | Open | High | Low | Close | Volume |
|---|---|---|---|---|---|---|
| 1 | 2025-06-09 | 244.12 | 246.89 | 243.50 | 245.67 | 58,312,400 |
| 2 | 2025-06-06 | 242.35 | 244.80 | 241.90 | 244.12 | 62,187,200 |
| 3 | 2025-06-05 | 240.78 | 243.15 | 240.10 | 242.35 | 55,843,600 |
| 4 | 2025-06-04 | 238.90 | 241.50 | 238.25 | 240.78 | 49,721,800 |
| 5 | 2025-06-03 | 237.45 | 239.80 | 236.90 | 238.90 | 51,456,300 |
| 6 | 2025-06-02 | 235.20 | 238.10 | 234.85 | 237.45 | 53,892,100 |
| 7 | 2025-05-30 | 233.60 | 236.25 | 233.10 | 235.20 | 47,218,500 |
| 8 | 2025-05-29 | 231.85 | 234.40 | 231.20 | 233.60 | 44,567,900 |
Popular stock market data workflows
Most people searching for stock market data want to do one of a few things quickly: pull prices, compare companies, analyze financial statements, or test a technical setup. Quadratic is built for all four.
Pull historical stock data
Ask for daily, weekly, or intraday data by ticker and date range, then chart it immediately or feed it into a backtest in Python.
View Stock Price History templateAnalyze fundamentals and financial statements
Pull revenue, net income, EPS, margins, and balance sheet data into one model so you can compare companies without leaving the spreadsheet.
View Company Fundamentals templateScreen technical setups
Layer moving averages, RSI, MACD, support levels, and watchlist logic on top of recent price action with formulas or generated Python.
Build repeatable portfolio analysis
Use Quadratic as a stock tracking spreadsheet for holdings, sector comparisons, public comps, and recurring market analysis.
Pull stock market data with AI
Ask for stock prices, financial statements, technical indicators, company news, or economic data in plain English. Quadratic's AI queries real stock market data APIs and brings the results directly into your spreadsheet — no API keys or setup required.
Turn market data into Python-powered analysis
Use Python in the same spreadsheet to clean financial data, calculate returns, build factor screens, compare securities, run technical studies, and create custom stock analysis workflows that go far beyond standard finance dashboards.
How to get stock market data in a spreadsheet
Go from question to analysis in three steps — no plugins, no API keys, no setup.
Ask AI for the data you need
Type a plain English request. Quadratic's AI figures out which stock market data API to call, writes the query, and runs it for you.
| A | B | C | D | E | |
|---|---|---|---|---|---|
| 1 | Date | Open | High | Low | Close |
| 2 | 2025-06-09 | 244.12 | 246.89 | 243.50 | 245.67 |
| 3 | 2025-06-06 | 242.35 | 244.80 | 241.90 | 244.12 |
| 4 | 2025-06-05 | 240.78 | 243.15 | 240.10 | 242.35 |
| 5 | 2025-06-04 | 238.90 | 241.50 | 238.25 | 240.78 |
| 6 | 2025-06-03 | 237.45 | 239.80 | 236.90 | 238.90 |
Data arrives in your spreadsheet
Results populate directly into your grid — structured, labeled, and ready to work with. No formatting, no copy-pasting, no CSVs.
Analyze and visualize
Use Python to calculate returns and run regressions. Use formulas for quick math. Create charts to spot trends. Everything in one file.
Stock analysis for every investor
Whether you trade on technicals, invest on fundamentals, or manage a portfolio — Quadratic gives you the data and tools in one place.
Value investors
Screen stocks by P/E, margins, and free cash flow. Pull financial statements, compare fundamentals across sectors, and build DCF models — all in one spreadsheet.
Technical traders
Layer RSI, MACD, Bollinger Bands, and moving averages on top of price data. Use Python to build custom signals and scan for setups across your watchlist.
Macro analysts
Combine interest rates, CPI, GDP, and index data alongside individual stocks. Build models that tie macro context back to your investment thesis.
Trend followers
Track momentum, breakouts, and moving average crossovers across tickers. Use Python to build systematic screens and surface names that are trending.
AI-powered financial data analysis
Quadratic acts like an AI assistant for stock market data. Ask questions like "Compare NVIDIA, AMD, and Intel over the last 12 months," "Pull Apple revenue and net income by year," or "Show RSI and MACD for Tesla over the last 90 days," and get tables, charts, and summaries directly in your financial statements spreadsheet.

Enterprise-grade financial data security
Quadratic works securely with stock market data and financial data workflows. We're SOC 2 and HIPAA compliant, and support self-hosting for enterprises that need full control over their financial data and stock analysis pipelines.
Get started building better analytics today.
Stock market data API access
Quadratic connects to stock market data APIs so you don't have to. No API keys, no rate limits, no boilerplate — just ask for the data and start analyzing.
Built-in API access
Quadratic handles the connection to stock market data APIs behind the scenes. You get the same data you'd get from Alpha Vantage, Polygon, or Yahoo Finance — without managing keys, pagination, or rate limits.
- Historical OHLCV, real-time quotes, financial statements
- Technical indicators, economic data, company news
- Options chains, ETF holdings, sector performance
Bring your own API
Already have an API key for a specific stock market data provider? Use Python in Quadratic to call any REST API directly — from premium data vendors to your own internal endpoints.
import requests

url = "https://api.example.com/v1/prices"
params = {"symbol": "AAPL", "range": "6mo"}
headers = {"Authorization": f"Bearer {API_KEY}"}

data = requests.get(url, params=params,
                    headers=headers).json()
df = pd.DataFrame(data["prices"])
Python stock data analysis in a spreadsheet
Write Python directly in your spreadsheet — no external IDE, no setup. Use pandas, numpy, and any library to analyze stock market data the way you want.
Calculate returns
Compute daily, weekly, or cumulative returns across any basket of stocks with a few lines of pandas.
returns = df["close"].pct_change()
cumulative = (1 + returns).cumprod()
sharpe = returns.mean() / returns.std()Build factor screens
Filter stocks by P/E, momentum, volume, or any custom factor. Combine multiple signals into a single score.
screen = df[
    (df["pe_ratio"] < 20) &
    (df["revenue_growth"] > 0.1) &
    (df["rsi_14"] < 70)
].sort_values("market_cap")Run technical analysis
Calculate moving averages, RSI, MACD, and Bollinger Bands. Overlay indicators on price data and backtest signals.
df["sma_20"] = df["close"].rolling(20).mean()
df["rsi"] = compute_rsi(df["close"], 14)
df["signal"] = np.where(
    df["close"] > df["sma_20"], 1, -1
)
Quadratic vs stock data add-ons and APIs
If you're comparing Quadratic with stock data add-ons like MarketXLS or Wisesheets, or direct market data APIs like Alpha Vantage or Polygon, the core difference is workflow. Quadratic gives you the data, analysis, charting, and Python generation in one spreadsheet instead of splitting them across tools.
| Feature | Quadratic | Stock data add-ons | Direct APIs |
|---|---|---|---|
| Best for | Analysis inside a spreadsheet | Adding stock data to Excel/Sheets | Building your own custom pipeline |
| Data access | AI + formulas + Python in one workflow | Mostly formula or add-on based | Raw endpoints only |
| Financial statements | Pull and analyze them in the same file | Usually available, but analysis stays manual | Available if you write the integration |
| Technical analysis | Charts, formulas, and generated Python | Usually limited to imported data | You build the indicators and charts yourself |
| Setup required | Open the sheet and ask | Install plugin, learn syntax, manage limits | Handle API keys, schemas, and code |
| Typical alternatives | Quadratic | MarketXLS, Wisesheets, SheetsFinance | Alpha Vantage, Polygon, direct APIs |
Stock market data FAQ
How do I get stock market data in a spreadsheet?
In Quadratic, you can ask AI for the stock market data you need in plain English — like "Pull 12 months of daily prices for AAPL" — and the data populates directly into your spreadsheet. You can also use the built-in STOCKHISTORY formula or write Python to query any stock market data API.
What kinds of financial data can I access?
Quadratic gives you access to historical stock data (daily OHLCV), real-time stock prices, financial statements (income statements, balance sheets, cash flow), fundamentals like P/E ratio and EPS, technical indicators (RSI, MACD, moving averages), company news, and economic data.
How is this different from stock data add-ons for Excel or Google Sheets?
Most stock market data tools for Excel or Google Sheets stop at getting data into the sheet and require paid add-ons or plugins. Quadratic gives you stock market data access built in — plus AI to query it, Python to analyze it, and charts to visualize it, all in the same workflow. No plugins, no setup.
How does Quadratic compare to MarketXLS, Wisesheets, or direct stock market data APIs?
Quadratic is designed for the full workflow, not just data access. Stock data add-ons like MarketXLS or Wisesheets are often strongest at pulling data into Excel or Google Sheets, while direct APIs like Alpha Vantage or Polygon are strongest if you want to build everything yourself. Quadratic combines stock market data, AI analysis, Python, formulas, and charting in one spreadsheet interface so you can move from question to answer faster.
Can I pull historical stock data?
Yes. You can pull full historical stock data including daily, weekly, or intraday OHLCV (open, high, low, close, volume) for any publicly traded stock. Use the STOCKHISTORY formula for quick lookups or ask AI for more complex historical data queries across multiple tickers and date ranges.
Can I access real-time stock data?
Yes. You can query real-time stock data including current prices, bid/ask spreads, market cap, daily change, and intraday data. AI queries pull the latest available data from market APIs directly into your spreadsheet.
Can I use Python to analyze stock market data?
Yes. Quadratic has Python built into the spreadsheet — no external tools or setup required. Use pandas, numpy, and other libraries to calculate returns, run regressions, build factor screens, perform technical analysis, and create custom stock analysis workflows on top of your financial data.
Can I access financial statements and fundamentals?
Yes. You can pull income statements, balance sheets, and cash flow statements for any public company. Access financial data like revenue, net income, EPS, P/E ratios, debt levels, margins, and more — directly into spreadsheet cells where you can build models and comparisons.
What does the STOCKHISTORY formula do?
STOCKHISTORY is a built-in formula that fetches historical stock data — open, high, low, close, and volume — directly in your spreadsheet by ticker and date range. It works like a native spreadsheet function with no API keys or setup required.
Is the stock market data secure?
Yes. Quadratic uses secure infrastructure and is SOC 2 and HIPAA compliant. Enterprise customers can self-host for full control over their financial data and analysis workflows.
Explore other connections
Quadratic supports a growing list of data sources. Combine and compare data across sources using Quadratic.


