Purpose of the fundamental analysis template
This fundamental analysis template compares financial metrics for up to three companies across a single fiscal year. It automates data retrieval for income statements, balance sheets, and key financial ratios, allowing you to visualize profitability and return metrics side-by-side for quick stock comparisons.
By using Python for real-time data fetching and charting, this workspace serves as a dynamic alternative to a static fundamental analysis excel template.
Core components and data flow
The template operates on a single sheet named Fundamentals, driven by a unidirectional data flow where inputs cascade directly to the table and then to the chart.
Configurable user inputs
User inputs are located on the single Fundamentals sheet in rows 3 and 4. This section acts as the single source of truth driving all downstream Python computations.
- Accepts up to three stock ticker symbols in cells B3, E3, and H3.
- Accepts a single fiscal year in cell B4.
Python-powered comparison table
The data table is generated by a Python code cell anchored at cell G6 and named Comparison_table. It reads the ticker and fiscal year inputs using q.cells() and calls q.financial.financial_statements() for each entered ticker symbol.
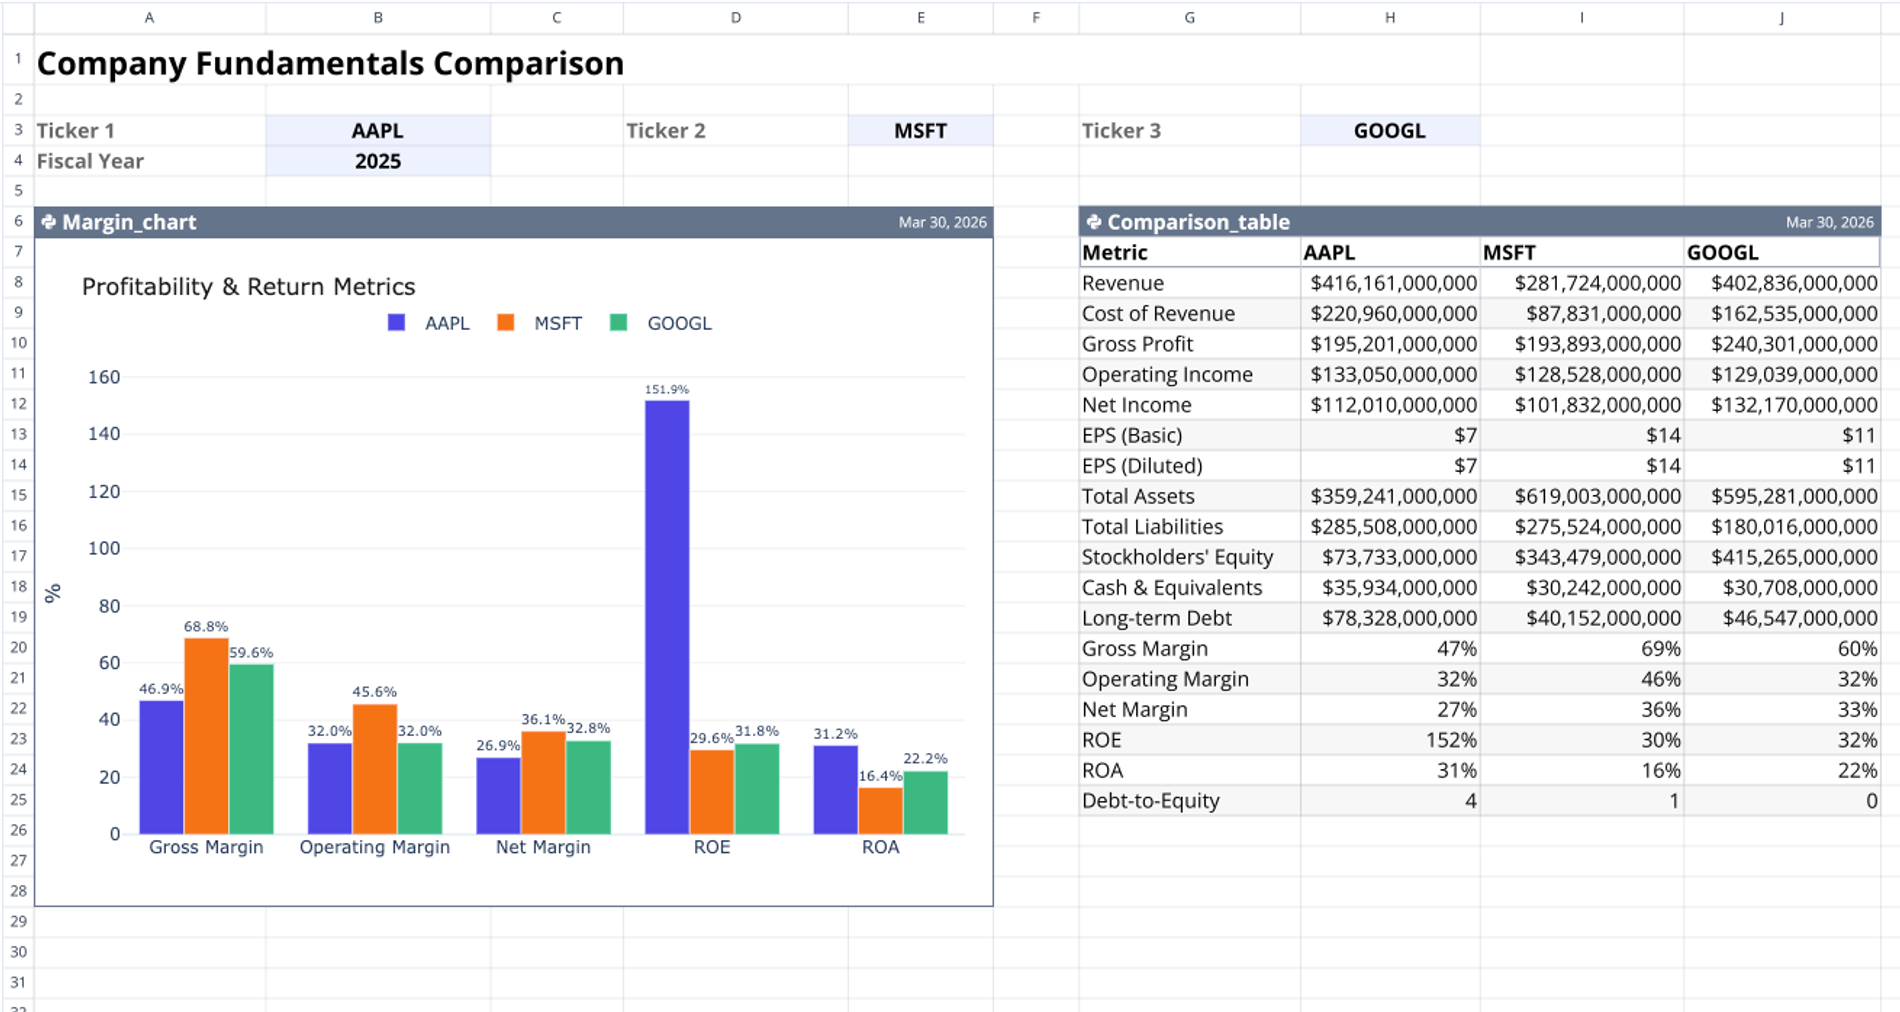
This compiles a pandas DataFrame containing 19 distinct financial metrics, including Revenue, EPS, Total Assets, Total Liabilities, and Debt-to-Equity. The resulting 19-row data table outputs directly to the sheet range G7:J25.
Interactive margin chart
A second Python code cell, anchored at cell A6 and named Margin_chart, creates the visual comparison. It reads data directly from the Comparison_table output range (G7:J25) using q.cells(first_row_header=True).
The code filters the dataset to isolate five key metrics: Gross Margin, Operating Margin, Net Margin, ROE, and ROA. After converting decimal values to percentages, it renders a grouped bar chart using the Plotly graph_objects library. The chart displays in the range A6:E28, complete with a horizontal legend and labeled percentage bars.
How to use this stock fundamental analysis excel template
Follow these steps to compare company data:
- Enter a primary stock ticker symbol in cell B3.
- Enter up to two competitor stock ticker symbols in cells E3 and H3.
- Input the target fiscal year in cell B4.
- Review the automatically generated financial metrics in the comparison table located at G7:J25.
- Analyze the updated Plotly bar chart in range A6:E28 to compare profitability and return ratios.
Changing any ticker or year input triggers a unidirectional data flow that automatically updates the table and chart.
Who this fundamental analysis template is for
This workspace is designed for data-driven professionals who need to compare stock metrics using a programmatic spreadsheet environment.
- Equity researchers conducting comparative company analysis.
- Retail investors evaluating competing stocks within the same sector.
- Financial analysts seeking a fundamental analysis template excel alternative with automated Python data pipelines.
Use Quadratic to do fundamental analysis
- Automate retrieval of 19 key financial metrics for up to three companies.
- Visualize profitability and return ratios side-by-side with interactive Plotly charts.
- Update financial data and charts instantly by changing a ticker or fiscal year.
- Maintain a single source of truth for all inputs, driving Python computations.
- Conduct comparative company analysis within a dynamic, browser-based environment.
Related templates
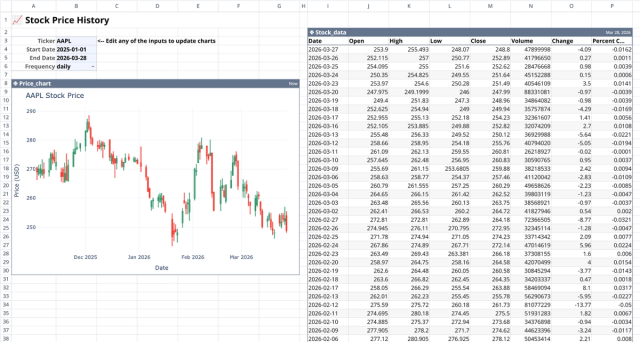
Stock History Calculator: Dynamic Price Chart
Visualize historical stock prices with customizable parameters.
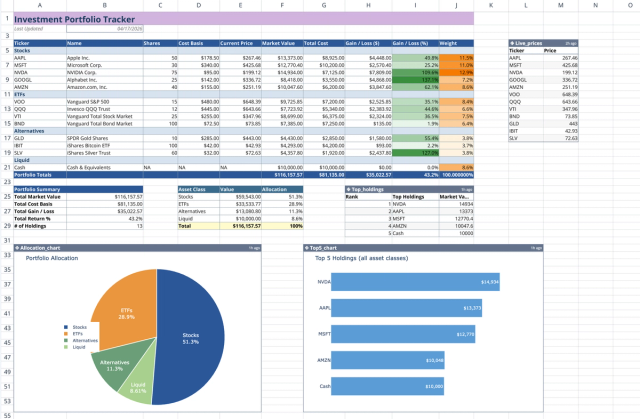
Investment Portfolio Template: Real-time Performance & Charts
Visualize and track your investment portfolio with live data.
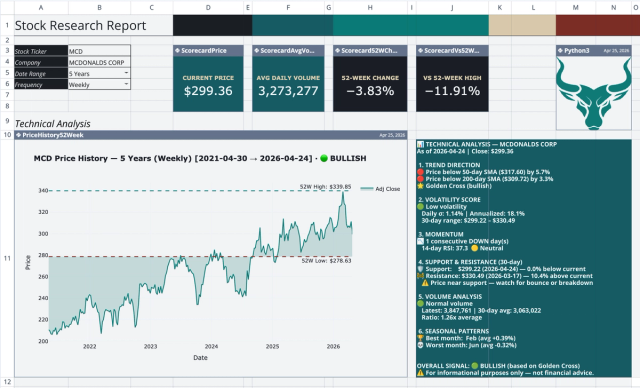
Stock Research Report Template: Live Stock Dashboard
Analyze a single stock's financial performance and risk.