
James Amoo, Community Partner
Mar 9, 2026

Table of contents
- Redefining financial reporting for modern teams
- The shift from static statements to dynamic workflows
- 5 financial reporting best practices for high-growth teams
- How Quadratic streamlines financial reporting
- How Quadratic compares with popular financial reporting tools
- Conclusion: building the best financial reporting workflow
- Frequently asked questions (FAQs)
For years, the definition of the best financial reporting has been tied to the output: a perfectly formatted set of financial statements delivered with precision. However, for modern finance teams, the output is no longer enough. The best reporting is defined by the workflow that produces it. It is not a static document delivered weeks after the month closes; it is an agile and continuous process that delivers insights while the data is still actionable.
Traditional reporting is often reactive, looking backward to compile what happened. In contrast, modern reporting is proactive, focusing on why it happened and what the business should do next. While accuracy remains table stakes, the true differentiators for high-performing finance teams are now speed, context, and auditability. By reducing the time to insight and eliminating manual data wrangling, finance professionals can transition from data compilers to strategic partners.
Redefining financial reporting for modern teams
To achieve the best financial reporting, teams must stop viewing reports as final destinations and start viewing them as live instruments. A static PDF of a P&L statement answers "how much," but it rarely answers "why" without significant manual digging.
The most effective reporting systems prioritize the mechanics of the data pipeline. They reduce the friction between the source of the data (ERPs, bank accounts, CRMs) and the analysis layer. When a finance team spends 80% of their time on data cleaning and only 20% on analysis and finance data visualization, the reporting process is broken. The best approach flips this ratio, automating the ingestion and validation steps so that the bulk of human effort is spent on variance analysis and strategic forecasting.
The shift from static statements to dynamic workflows
The traditional monthly close often involves a grueling 10 to 15-day cycle. By the time the reports are finalized and emailed to stakeholders, it quickly becomes stale data. This latency creates a disconnect between financial reality and operational decision-making. Furthermore, this process often leads to version control issues, where analysts juggle multiple spreadsheet files labeled "v2_final_FINAL," making it nearly impossible to trust which numbers are current.
Dynamic workflows solve this by treating reporting as a continuous stream rather than a batch process. In a modern financial reporting platform, data feeds are live or scheduled to update automatically. This allows finance teams to run variance analyses in real-time, catching discrepancies as they happen rather than waiting for the end of the month.
This shift is essential for finance teams aiming to increase their influence within the organization. When reporting moves from a compliance exercise to a dynamic operational tool, finance leaders can provide the immediate context department heads need to pivot strategies or optimize spend. Adopting the best BI tools for financial planning reporting transforms the finance function into a central nervous system for the business.
5 financial reporting best practices for high-growth teams
Building a robust reporting engine requires more than just hard work; it requires the right architecture. Here are five practices that distinguish top-tier finance operations.
1. Automate data ingestion
The era of downloading CSV files from an ERP and pasting them into a spreadsheet should be over. Best practices dictate establishing direct connections to your core systems, such as ERPs, HRIS, and bank feeds. By automating data ingestion, you create a single source of truth that updates without human intervention, significantly reducing the risk of copy-paste errors. Using one of the best automated financial reporting platforms allows these pipelines to run in the background and helps to streamline CSV data analysis.
2. Unify financial and operational data
Financial numbers rarely tell the whole story on their own. To understand revenue, you need to see it alongside customer acquisition costs (CAC) or user growth. To understand payroll, you need headcount and hiring plan data. The best reporting combines these silos, enabling data blending by merging financial ledger data with operational metrics. This helps in providing a complete picture of business health through the consolidation of financial information.
3. Prioritize auditability and transparency
Spreadsheet automation should never be a black box. If a stakeholder asks how a specific metric was calculated, the finance team must be able to trace the logic instantly. The best workflows ensure that formulas, code, and data transformations are visible and auditable. When stakeholders can see the logic behind the numbers, they are less likely to question the validity of the report.
4. Enable self-service for stakeholders
Finance teams often become bottlenecks because they hold the keys to the data. Modern reporting empowers department heads to answer their own basic questions through accessible dashboards. Instead of emailing a static attachment, finance can provide a link to a live report where stakeholders can view their budget vs. actuals in real-time.
5. Accelerate the close
Waiting until day 30 to start checking for errors guarantees a stressful close. By using automation for robust transaction tracking to run error checks and reconciliations continuously throughout the month, teams can spot anomalies early. This continuous close approach spreads the workload evenly and allows for a faster and more accurate final reporting cycle.
How Quadratic streamlines financial reporting
Many organizations rely on multiple tools for financial reporting tasks. Spreadsheets for calculations, BI platforms for visualization, and separate analytics environments for deeper analysis.
Quadratic streamlines financial reporting by bringing these capabilities into a single environment. By combining the familiar spreadsheet interface with the analytical power of programming languages such as Python and SQL, making it one of the best financial reporting tools to use.
AI-powered data analysis and visualization
Quadratic’s built-in AI agents for data analysis help finance teams quickly analyze large financial datasets and uncover meaningful insights. Users can prompt the AI to identify trends in revenue, generate analysis queries, or highlight anomalies that may require further investigation. Let’s see an example.
First, I import my data into Quadratic:
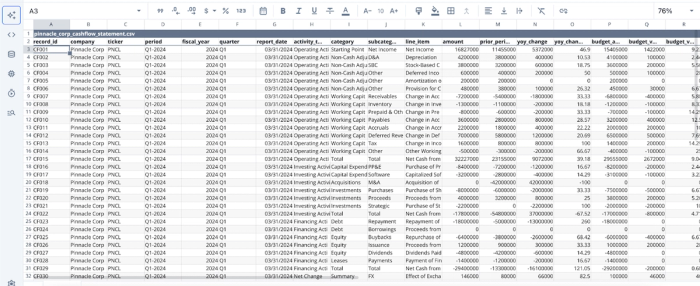
After a successful import, we can begin analysis immediately. Here:
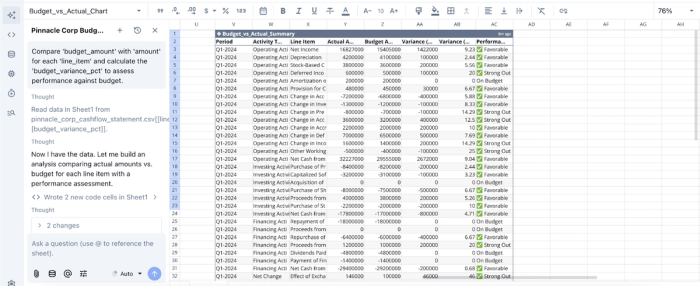
In this image, I ask Quadratic to provide a comparison between the budgeted amount and the actual amount for each line item. It instantly scans through the dataset and generates the assessment for each line item, showing the budget, actual amount, variance, and an assessment summary.
Quadratic also enables users to generate charts and visualizations using AI prompts or code, making it easier to create dashboards that illustrate financial trends and KPIs. Finance teams can quickly visualize metrics such as revenue growth, cost structures, or cash flow projections. Let’s see an example of this with our existing dataset:
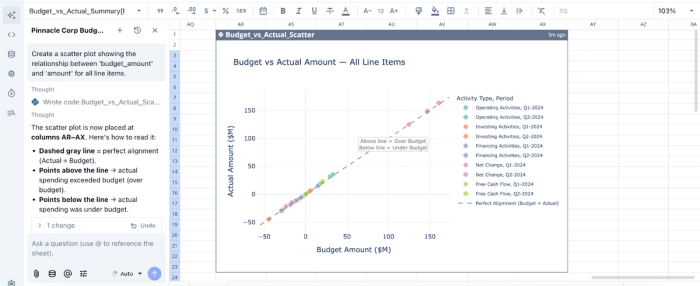
In the image above, I ask Quadratic to “Create a scatter plot showing the relationship between budget amount and amount for all line items.” It generates an interactive and customizable chart that better communicates the relationship between the budget amount and the actual amount.
Native support for modern programming languages
One of Quadratic’s key strengths is its native support for programming languages such as Python, SQL, and JavaScript directly within spreadsheet cells. This coding spreadsheet allows analysts to go beyond basic spreadsheet calculations and perform advanced financial analytics when needed.
For example, finance teams can use Python libraries like Pandas to manipulate large financial datasets, run statistical analysis on financial trends, or automate complex reporting workflows. Finance teams can maintain the flexibility of spreadsheets while gaining the analytical power of modern programming tools.
Direct connection to multiple data sources
Quadratic allows users to connect directly to databases, APIs, and other financial data sources like Plaid. This ensures that reports can be generated using live operational and financial data rather than static exports.
With direct data connectivity, finance teams can reduce manual data exploration and update reports more frequently. This helps organizations maintain accurate financial visibility and respond quickly to changes in business performance.
Collaboration
Financial reporting often involves collaboration across finance teams, analysts, and business stakeholders. Quadratic supports shared workspaces where multiple users can work on financial models and reports simultaneously.
It provides a collaborative environment where teams can review calculations, validate assumptions, and ensure consistency across reports. It also reduces the need for multiple versions of spreadsheets circulating across teams.
How Quadratic compares with popular financial reporting tools
In this section, we’ll see how Quadratic compares with popular financial reporting tools.
| Metric | Quadratic | Oracle NetSuite | QuickBooks | Vena Solutions |
|---|---|---|---|---|
| AI data analysis | Quadratic’s built-in AI can analyze financial data and help identify patterns automatically | Limited AI analytics are primarily focused on ERP reporting automation | Basic automated insights, but limited advanced analysis | AI features focused mostly on planning and variance analysis |
| AI finance visualization | Generate charts and dashboards AI prompts for dynamic financial reporting | Standard financial dashboards with limited customization | Prebuilt charts for accounting reports | Visualization tools are mainly tied to planning dashboards |
| Programming Language Support | Supports Python, SQL, and JavaScript directly in the spreadsheet for advanced financial modeling | No native programming environment for custom analytics | No native support for coding within reports | Limited scripting compared to code-first analytics tools |
| Live Data Connectivity | Connect directly to databases, APIs, and external data sources to analyze real-time financial data | Integrates with ERP financial data and internal modules | Integrates primarily with accounting data sources | Integrates with ERP and financial systems |
| Exploratory Financial Analysis | Analysts can perform ad-hoc financial analysis directly in the spreadsheet using AI, formulas, or code | Focused on standardized ERP reporting | Designed mainly for bookkeeping and reporting | Primarily planning and budgeting analysis |
| Collaboration | Real-time collaboration lets multiple users work on the same financial analysis simultaneously | Collaboration through ERP workflows | Limited collaboration compared with analytics platforms | Collaboration within planning processes |
Conclusion: building the best financial reporting workflow
The best financial reporting is about building a trusted and automated engine that frees the finance team to think strategically. When you stop wrestling with data transformation and manual reconciliation, you gain the time to analyze variances, forecast scenarios, and partner with business leaders to drive growth.
Transitioning to this model requires moving away from static files and embracing dynamic workflows. By connecting your data directly to your analysis layer, you ensure that your reporting is always timely, accurate, and actionable.
Quadratic allows you to modern financial reporting workflow by connecting your core financial data, automating analysis, and creating transparent reports. Try Quadratic for free.
Frequently asked questions (FAQs)
What defines the best financial reporting in a modern business context?
The best financial reporting today is characterized by dynamic, automated workflows that deliver timely insights, rather than just static reports. It prioritizes speed, context, and auditability, allowing finance teams to be proactive strategic partners. This shift moves beyond merely compiling data to understanding the "why" behind the numbers.
Why are traditional financial reporting tools often insufficient for high-growth teams?
Traditional financial reporting tools typically force a choice between the rigidity of ERP modules and the manual chaos of disconnected spreadsheets. They often lack the flexibility for custom modeling, direct data connectivity, and the familiar interface necessary to build agile, automated workflows required by modern finance teams.
How does Quadratic support modern financial reporting best practices?
Quadratic enables best financial reporting practices by bridging the flexibility of a spreadsheet with the power of a modern data platform. It allows finance professionals to connect directly to live data sources, analyze using Python, SQL, or formulas, and build a customizable financial reporting platform where data and analysis update automatically. This fosters transparent, auditable, and instantly actionable reports.
What capabilities should the best financial reporting software offer?
The best financial reporting software should provide flexibility for custom logic and unique KPIs, direct connectivity to various data sources like ERPs and databases, and a familiar interface like a spreadsheet grid. These features empower finance teams to create tailored reports efficiently and reduce manual data wrangling.