James Amoo, Community Partner
Sep 11, 2025

Python and SQL have become nearly ubiquitous tools among data analysts. According to industry surveys, approximately 90% of data science professionals actively use Python in their work, while around 53% leverage SQL for data analysis. This shows the importance of both languages in optimizing data analytics strategy and empowering data analysts to extract actionable insights from their data.
While SQL excels at managing and querying relational databases, providing the foundation for retrieving and manipulating structured data, Python offers flexibility for advanced data analysis, quantitative analysis, and visualization. Together, they form a partnership for working with data: SQL handles efficient data extraction, and Python enables deeper data exploration, modeling, and automation.
It is beneficial for data analysts to learn Python and SQL, as they are part of the must-have skills for data analysts. Their relatively gentle learning curves make them accessible to beginners, while their extensive libraries and capabilities meet the demands of sophisticated data science projects. Individually, each language is highly useful; combined, they allow you to generate meaningful insights, bringing you closer to the future of data analytics.
In this blog post, we’ll explore the fundamentals of SQL and Python for business data analysis. You’ll learn about their features, typical use cases in everyday data workflows, and how they complement each other. Further, we’ll introduce Quadratic, an AI tool for data analysis that allows you to run both Python and SQL commands directly within your spreadsheet, eliminating the need to switch between multiple applications to achieve your desired result.
What is Python?
Python is widely recognized for its role in data analytics, but its capabilities extend far beyond that. As a versatile and general-purpose programming language, Python is used across a wide range of fields, offering solutions for everything from software development to automation and machine learning. Its readable syntax makes it accessible to beginners while remaining powerful enough for experts.
Traditionally, generating insights from spreadsheet data involved memorizing and applying complex formulas, which could be both limiting and time-consuming. With Python, data analysts can also use code for exploratory data analysis, automation, and building predictive models.
Python continues to prove its versatility as it is widely used in fields such as software development, game development, machine learning, and data analysis. Let's explore the key features of Python:
Features of Python
- Easy and readable syntax: Compared to other programming languages, Python's syntax is easy to learn and use. This makes it easy for beginners to use and make meaningful contributions in a short time.
- Dynamically typed: Python is a dynamically typed language, which means you don’t have to explicitly declare the type of the variable.
- Rich ecosystem of libraries: Python offers a diverse range of libraries that streamline data manipulation, analysis, and visualization.
- Data handling capabilities: Python easily handles common data file formats, including CSV, JSON, Excel, and Parquet.
- Scalability: Python is built to handle and analyze large amounts of data without slowing performance bottlenecks.
What is SQL?
SQL (Structured Query Language) is a declarative programming language designed to retrieve and manage data stored in relational databases. It provides built-in commands (such as SELECT, JOIN, UPDATE, and DELETE) that allow users to access, modify, and maintain their data seamlessly. Thanks to its simple and readable syntax, SQL enables analysts to query data efficiently, just as Python streamlines analysis.
Although SQL excels at querying and managing structured data, it has limitations when it comes to advanced analysis, statistical modeling, or data visualization. For these tasks, Python often proves more effective due to its rich ecosystem of libraries and flexibility. Still, SQL remains one of the most widely adopted tools across industries that rely on databases. Its speed in extracting information and ability to handle complex queries make it a valuable tool in fields like engineering, finance, and health care. Let’s explore the features of SQL:
Features of SQL
- Declarative language: SQL is a declarative language, which means users can simply describe what they want, and not necessarily how to go about it.
- Data retrieval: SQL performs excellently in retrieving data from large datasets using its built-in commands like
SELECT. - Data manipulation: SQL allows users to add, update, or delete records seamlessly from their database.
- Data cleaning: Users can easily use SQL commands to clean, sort, and filter data directly in their database.
- Wide compatibility: It is widely compatible with almost all relational Database Management Systems (DBMS), including MySQL, SQL Server, Oracle, and Postgres.
SQL for data analytics
In this section, we’ll be going deeper into the practical use cases of SQL for data analysis, showing you code snippets on how to perform tasks like data retrieval, data aggregation, joining tables, and data cleaning.
Data retrieval
SQL efficiently extracts specific data from large databases with the help of its built-in queries. Suppose you want to retrieve customer names and email from a large database of customer tables, you use the SELECT and FROM queries. Here:
SELECT
    customer_name,
    email
FROM
    customers
Data aggregation
SQL data analytics provides the ability to perform aggregation on your data, getting insights such as sum, average, and count operations. Suppose we want to find the total number of customers and total orders from customers in the United States:
SELECT
    COUNT(DISTINCT c.customer_id) AS total_customers,
    COUNT(o.order_id) AS total_orders
FROM
    customers c
JOIN
    orders o ON c.customer_id = o.customer_id
WHERE
    c.country = 'United States';
This counts the number of unique customers from the United States and then counts how many orders those customers made.
Joining tables
Gaining insights from data often requires combining information from multiple tables and exploring how they relate to each other. SQL makes this possible through the JOIN keyword, which allows you to connect tables and analyze their relationships. Let’s see how we can join the customers and orders so we can see customers with their specific orders:
SELECT
    c.customer_name,
    o.order_id,
    o.order_amount
FROM
    customers c
JOIN
    orders o ON c.customer_id = o.customer_id
WHERE
    c.country = 'United States'
ORDER BY
    o.order_amount DESC;
This joins the customers table with the orders table, allowing analysts to have more context into how they relate.
Data cleaning
SQL is also useful for data cleaning tasks such as filtering, sorting, managing missing values, and removing duplicates. For example, let’s look at how to eliminate duplicate customer records from a database:
DELETE FROM customers
WHERE customer_id NOT IN (
    SELECT MIN(customer_id)
    FROM customers
    GROUP BY email
);
This groups all the customers by email, records the first occurrence, and gets rid of the duplicates.
Python for data analysis
Python can be used for a variety of tasks in data analysis, from data cleaning and manipulation to data analysis and visualization. Let’s talk about this in detail.
Data cleaning
Thanks to its rich ecosystem of libraries, data cleaning in Python is more intuitive, especially for large datasets. Pandas, a Python library used for data manipulation and analysis, offers built-in functions that simplify these tasks. For example, here’s how we can remove duplicate records using Pandas for Excel users:
import pandas as pd
df = pd.read_csv('Data.csv')
df.duplicated()
df.drop_duplicates()
This snippet loads data from a CSV file, identifies duplicate rows, and removes them. To run it, simply provide the name of your CSV file as an argument to the read_csv() function. Learn how you can analyze your CSV data.
Data analysis
Python enables data analysts to uncover valuable insights quickly and efficiently. Building on our earlier example, we can use it to identify the top five customers based on total spending, average order value, and the number of orders. Let’s see how this works:
import pd from pandas
# Load data from CSV
customers = pd.read_csv("customers.csv")
orders = pd.read_csv("orders.csv")

# Aggregation: total and average order amount per customer
summary = data.groupby("customer_name")["order_amount"].agg(
    total_spent="sum",
    average_order="mean",
    total_orders="count"
).reset_index()

top_spenders = summary.sort_values(by="total_spent", ascending=False).head(5)

print("Top 5 Customers by Spending:")
print(top_spenders)
This code snippet loads the CSV files, then calculates the total amount for the customers, the average order value, and the total number of orders. Finally, it sorts the result by total spent and shows the top 5 customers.
Data visualization
One aspect where SQL lags behind Python is data visualization. Python offers a wide range of visualization libraries that enable analysts to transform raw data into insightful visuals, allowing data analysts to understand their data better. Let’s see how we can visualize this data using Matplotlib, a Python data visualization library:
import matplotlib.pyplot as plt

plt.figure(figsize=(8, 5))
plt.bar(top_spenders["customer_name"], top_spenders["total_spent"])

plt.title("Top 5 Customers by Total Spending")
plt.xlabel("Customer Name")
plt.ylabel("Total Spent")
plt.xticks(rotation=45)
plt.tight_layout()
plt.show()
This code snippet creates a bar chart that ranks the top 5 customers in order.
Quadratic for data analysis
Quadratic is an AI-powered spreadsheet built to streamline your analysis workflow and make data insights more accessible. Unlike traditional tools where Python or SQL expertise is often required, Quadratic empowers non-technical users, technical users, and citizen developers to analyze and interpret data with ease. This means that you do not necessarily have to learn SQL and Python to generate insights from your data. This fosters self-service analytics while promoting data democratization and accessibility across organizations.
By offering a centralized environment for accessing, analyzing, and visualizing data, Quadratic removes the need to juggle multiple database query tools or external libraries. Its built-in IDE lets users write Python or SQL code directly within the spreadsheet, making it not only a coding spreadsheet but also one of the best IDEs for data analysis.
With its AI spreadsheet analysis technology, Quadratic helps analysts do more with less effort. It integrates seamlessly with databases, APIs, and raw data, allowing users to import data via SQL and dive straight into advanced analysis using Python. The results can then be applied instantly to their spreadsheet. Let’s see how we can perform data cleaning, data analysis, and data visualization using Quadratic.
Data cleaning using Quadratic
With Python or SQL, cleaning data means writing multiple lines of code or using data cleaning tools. In Quadratic, it’s as simple as asking a question. You can choose to specifically highlight how you want to clean your data or simply type, “Clean this data”. Quadratic instantly generates a cleaned version of your dataset. Consider this dirty dataset:
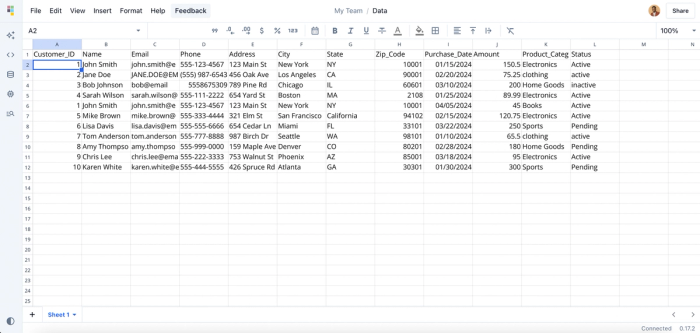
This messy Excel data contains inconsistent formatting, invalid data, duplicate records, and other forms of inconsistencies. I’ll go ahead and ask Quadratic to clean messy spreadsheet data so it’s suitable for analysis. Here’s the result:
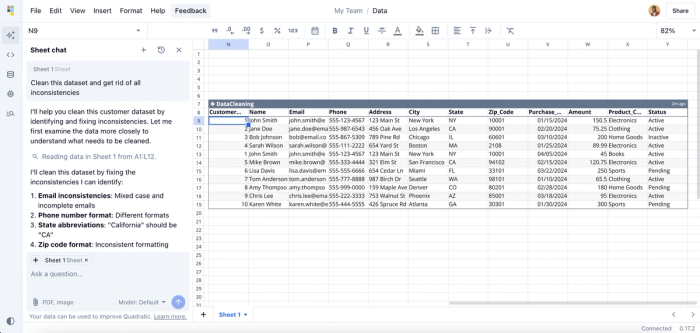
With a simple prompt like “Clean this dataset and get rid of all inconsistencies,” Quadratic generates a new table within seconds, fixing errors in emails, phone numbers, abbreviations, and more.
Data analysis using Quadratic
Just like data cleaning, generating insights in Quadratic is as simple as asking questions. In this example, we’ll pull data from a Postgres database using SQL, then proceed directly to analysis within Quadratic. Let’s begin by retrieving the data with SQL queries:
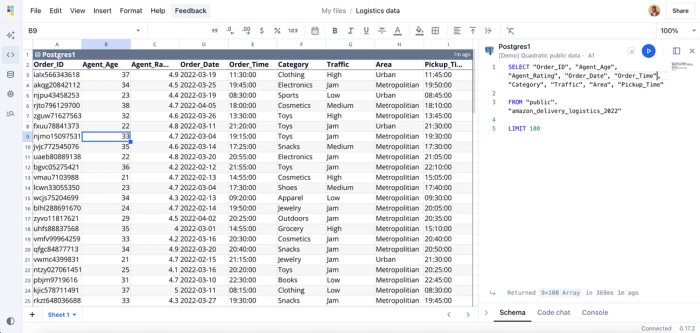
Since Quadratic allows us to use SQL with Python in the spreadsheet (a much better alternative to SQL in Excel), we retrieved data into our spreadsheet using SQL queries. The database contains delivery logistics data. We can then proceed to analyze our data using Python or simply ask questions using Quadratic. Let’s see how we can get the days that had the fastest delivery time:
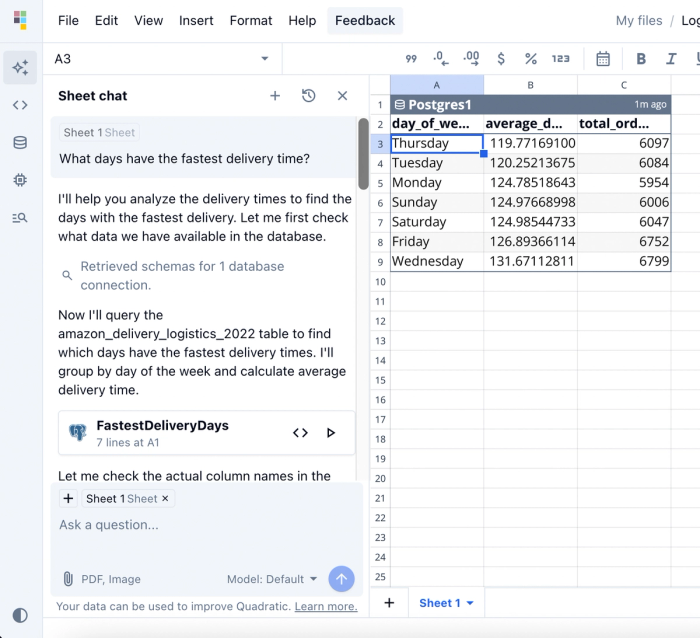
Here, we pass the prompt “What days have the fastest delivery time?”. Quadratic instantly produces a table ranking each day of the week by average delivery time, along with the total number of orders. Learn how you can easily export from Postgres to CSV with Quadratic.
Data visualization using Quadratic
With Quadratic, you do not need a third-party tool to create interactive visualizations from your data. With text prompts describing how you want to present your data, Quadratic generates Python code to visualize your data using different chart types. For example, if we want to get visual insights into what areas have the most traffic, we can create a chart to display the relationship between traffic and delivery areas:
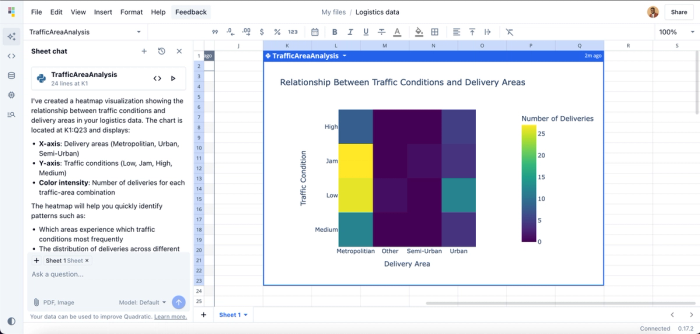
Here, we passed the prompt “Create a graph showing the relationship between traffic and area in this logistics data.” In seconds, Quadratic generates a heatmap that makes it easy to spot common traffic areas from the logistics data, making it an efficient database visualization tool.
Quadratic vs SQL vs Python for data analysis
In this section, we’ll compare Quadratic vs Python vs SQL, using metrics such as scalability, purpose, performance, and ease of use. Here:
| Features | Quadratic | Python | SQL |
|---|---|---|---|
| Purpose | AI-powered spreadsheet for data analysis, data visualization, business intelligence, finance, and product management | Used for data science, web development, machine learning, automation, etc | Used to interact with relational databases |
| Scalability | Highly scalable, suitable for large datasets | Scalable for applications | Scalable either by the addition or removal of tables |
| Performance | Can handle complex operations | Slows down with extensive computations | Optimized for data retrieval and aggregations. Slows down with complex queries |
| Ease of use | Intuitive spreadsheet interface makes it user-friendly | Easy to learn, but has many concepts that users are required to learn to achieve their desired result | Easy to learn with a few concepts |
| Open source | Yes | Yes | No |
| Data visualization | Can generate interactive visualizations using text prompts | Can create visualizations with the help of libraries | Can not be used to create visualizations |
Conclusion
Learning to code can feel overwhelming at first, especially without prior programming experience. Yet for data analysts and anyone looking to get into data analytics, gaining proficiency in Python and SQL is important to gaining actionable insights from their data. These languages streamline your workflow, from data retrieval and data transformation best practices to visualization and reporting.
Although SQL and Python are relatively easy to learn, they can quickly become complex. That’s where AI-powered spreadsheets like Quadratic come in. Quadratic brings everything into one centralized environment, so you never need to leave your spreadsheet to retrieve, analyze, and visualize data. For experts, it also offers the flexibility of writing custom Python scripts or SQL queries directly within the spreadsheet.
In this post, we explored Python and SQL in data analysis, their use cases, features, and key differences. We also saw how Quadratic allows you to conduct advanced analysis on your data without Python or SQL expertise. Try Quadratic out for free today.