James Amoo, Community Partner
Jul 24, 2025

Whether you're an expert data analyst or just beginning your journey into data, data analysis is an essential skill in today’s data-driven world. At its core, data analysis involves transforming raw data into meaningful insights. These insights enable organizations and businesses to understand trends, make informed decisions, and develop effective strategies for growth and optimization.
One of the most powerful and widely used tools in this process is SQL. It enables data analysts to access, clean, manipulate, and analyze data stored in relational databases with precision and efficiency.
While SQL is relatively easy to pick up compared to many modern programming languages, attaining mastery still requires time and practice. That investment, however, is highly rewarding. SQL data analytics is a key asset for tasks like data automation, AI data modeling on structured datasets, and exploratory data analysis in SQL.
In this blog post, we’ll explore SQL for data analysis, discussing popular SQL techniques, their applications, benefits, and limitations. Finally, we’ll see how Quadratic, a powerful AI spreadsheet tool, brings it all together in one seamless experience: querying, visualizing, and iterating on your analysis, all within a single browser tab.
First, what is SQL?
SQL (Structured Query Language) is a standard programming language designed to manage and interact with data stored in relational databases. A relational database organizes data into structured tables that are linked through predefined relationships using keys or unique identifiers. This makes it easier to store and retrieve complex data efficiently.
SQL allows users to perform a wide range of operations, including data insertion, deletion, updating, retrieval, filtering, and aggregation. Its English-like syntax makes it accessible to technical users and citizen developers. One of the key advantages of data analysis using SQL is its ability to handle large volumes of data directly from the database, eliminating the need for manual manipulation or copy-pasting.
Thanks to its versatility, SQL is used extensively across various industries such as finance, engineering, healthcare, e-commerce, and digital marketing. Whether you're running complex queries, generating reports, or preparing data for machine learning, data analysis with SQL remains a must-have skill for data analysts.
Why use SQL for data analytics?
We mentioned that data analysts use SQL to manage and query relational databases. Let’s explore other benefits of using SQL for data analysis:
- Speed: SQL is well optimized to query and aggregate data quickly and efficiently without compromising performance.
- Readable syntax: With a syntax that closely mirrors natural English, SQL is both easy to learn and intuitive to use. This helps to bridge the gap between data literacy and data fluency, allowing analysts to extract meaningful insights from their data quickly.
- Automation: SQL is a key tool in data automation as advanced queries are used in data pipelines, ETL pipelines, and machine learning pipelines.
- Business intelligence: While data analysts often rely on BI tools like Power BI and Tableau for visualization and reporting, SQL serves as the backbone of business intelligence as queries are used to power dashboards, feed data pipelines, and track key metrics.
- Wide support: SQL is supported by major database management systems, including MySQL, PostgreSQL, and SQL Server. This ensures SQL skills are highly transferable and not limited to a single platform.
Common SQL queries for data analysis
Let’s take a look at the common SQL queries used in data analysis:
- SELECT: The
SELECTstatement is used to retrieve data from one or two tables. You specify the name of the columns using theSELECTstatement and identify the table name using theFROMclause. - JOIN: As the name implies, the
JOINstatement is used to combine rows from two or more tables. - WHERE: The
WHEREclause is used to filter rows in a table so that it features only rows that meet the specified condition. It is similar to data retrieval using theSELECTstatement, only that a condition is required in this case. - GROUP BY: The
GROUP BYstatement is used to group rows that share the same values. It is often used with aggregate functions likeSUM(),COUNT(), andAVG(). - ORDER BY: The
ORDER BYclause determines how the rows are sorted in the database. Data is ranked in ascending order by default.
SQL data analysis: Common techniques
SQL offers several techniques that enable analysts to perform deeper analysis on their data. Let’s discuss some of these techniques:
SQL aggregation
SQL aggregation is a technique used to summarize large datasets for quick insights and decision-making. It involves performing calculations across multiple rows to return a single summary value. This method is commonly used with aggregate functions such as SUM(), COUNT(), AVG(), MAX(), and MIN().
For example, if you have a table of sales transactions and want to calculate the total profit, you can use the SQL SUM() function to add up all profit values in the dataset. Consider this example below that calculates how much a salesperson sold in a particular month:
SELECT
    salesperson,
    SUM(sales_amount) AS total_sales
FROM
    sales_data
WHERE
    sale_date BETWEEN '2025-06-01' AND '2025-06-30'
GROUP BY
    salesperson;
First, we retrieve the data using the SELECT statement and FROM clause. We then use the SUM aggregate function to get the total of the sales_amount and save it in a new variable called total_sales. This gives us the value of the total sales.
Next, the WHERE clause is used to filter out data so that we get data for only the month of June. Finally, we aggregate the data using the GROUP BY statement to get the total monthly sales by each salesperson.
SQL window functions
Window functions in SQL allow analysts to perform calculations across a set of related rows, without collapsing the result into a single summary value. Unlike aggregation functions, window functions retain row-level detail while computing values over a defined window of rows. They are useful for analyzing trends within groups, creating rankings, and calculating running totals or averages.
Suppose you want to calculate each salesperson’s sales as a percentage of the monthly sales:
SELECT
    salesperson,
    sale_date,
    sales_amount,
    sales_amount * 100.0 / SUM(sales_amount) OVER () AS percent_of_total
FROM
    sales_data
WHERE
    sale_date BETWEEN '2025-06-01' AND '2025-06-30';
The code block above retrieves the sales data. The window function is then used to express the sales amount of each salesperson as a value of the total. The value is stored in a newly created variable called percent_of_total.
Pivot data in SQL
Pivoting data means turning rows into columns. This technique is used to reshape and summarize data tables so they’re more suitable for reporting and comparison. For instance, you may want to compare the sales across different months side-by-side or summarize answers in a survey response so that you know how many respondents selected each option.
SQL has a PIVOT operator, but it’s only available in SQL Server and Oracle. Alternatively, a combination of CASE + GROUP BY can be used to pivot data in SQL. This works in all SQL dialects. Suppose you have a table of sales data:
| Product | Month | Revenue |
|---|---|---|
| Laptop | Jan | 90 |
| Laptop | Feb | 120 |
| Phone | Jan | 80 |
| Phone | Feb | 150 |
Using the CASE + GROUP BY combination:
SELECT
  product,
  SUM(CASE WHEN month = 'Jan' THEN revenue ELSE 0 END) AS jan_revenue,
  SUM(CASE WHEN month = 'Feb' THEN revenue ELSE 0 END) AS feb_revenue
FROM sales
GROUP BY product;
This code block pivots the month value into columns and then summarizes the revenue per product. Here’s the output:
| Product | jan_revenue | feb_revenue |
|---|---|---|
| Laptop | 90 | 120 |
| Phone | 80 | 150 |
The pivoted format provides a more organized summary of the data, making it easier to compare values across categories. See how you can update pivot tables automatically with AI.
Limitations of SQL for data analysis
- Complex queries require expertise: Leveraging the advanced capabilities of SQL requires a high degree of technical expertise, which can be challenging for beginners trying to perform more complex data tasks.
- Limited to structured data: SQL works best for structured data. Working with unstructured data like text, images, and audio would require additional tools.
- Performance issues with large datasets: SQL queries can become slow or unresponsive with large datasets, especially when not properly indexed.
- No support for data visualization: SQL primarily does not support visualization. Data analysts have to use BI tools or modern solutions like Python inside of your spreadsheet to visualize their data.
- No support for machine learning: SQL isn’t designed for machine learning or building predictive models; users looking to achieve such use cases would need external tools like Python or Julia.
Quadratic: the all-in-one AI spreadsheet for data analysis
Quadratic not only overcomes the limitations of SQL for data analytics, but it also redefines the workflow entirely. As an AI tool for data analysis, Quadratic provides a centralized environment where users can query, analyze, and visualize data seamlessly, all within a single browser tab.
Unlike traditional workflows that require jumping between SQL editors, BI tools, and database query tools, Quadratic streamlines the entire process, eliminating the need for complex setups and time-consuming tool switching.
Run and visualize SQL queries directly in your spreadsheet
Quadratic features a built-in IDE for data analysis that allows data analysts to write and execute code directly within the spreadsheet environment. It offers native support for modern programming languages, including Python, JavaScript, and SQL.
With direct connections to databases, APIs, and raw data sources, Quadratic eliminates the need for manual data updates. Your data stays live and up to date, enabling real-time data analysis. Just connect your data source and start writing code immediately. No manual installation or setup delays.
Supercharge your analysis with AI assistance
Not sure how to write code or SQL queries for your analysis? Quadratic’s built-in AI feature allows users to leverage LLMs for data analysis. This makes it a versatile tool for users of all skill sets, as data analysts can get faster insights on their data by using simple text prompts.
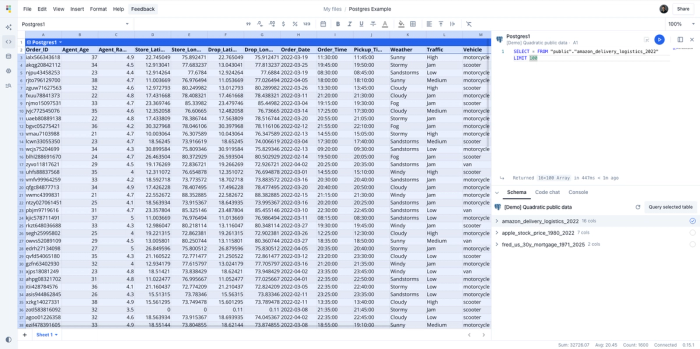
In the image below, I queried the first 100 rows of a sample Postgres database within Quadratic by selecting my database, and then selecting the table of interest from that Postgres database:
Once I had my data on the grid, I opened the “Code chat” tab and asked in plain language to “Calculate actual delivery distances using the store and drop coordinates”. Quadratic’s AI generated complex SQL code, which created a new column in my dataset “delivery_distance_km” calculating delivery distance with the haversine formula.
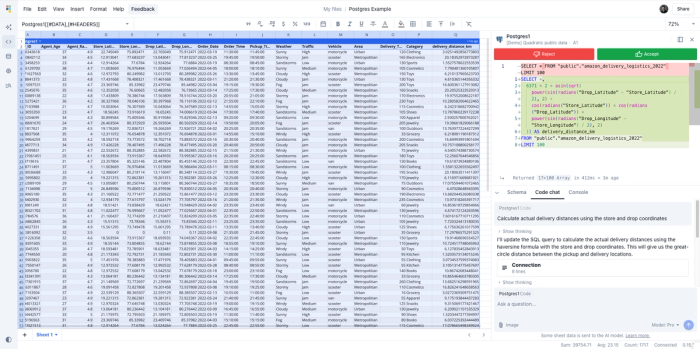
Here’s the SQL that was generated and run inside of the sheet:
SELECT *,

6371 * 2 * asin(sqrt(

power(sin(radians("Drop_Latitude" - "Store_Latitude") / 2), 2) +

cos(radians("Store_Latitude")) * cos(radians("Drop_Latitude")) *

power(sin(radians("Drop_Longitude" - "Store_Longitude") / 2), 2)

)) AS delivery_distance_km

FROM "public"."amazon_delivery_logistics_2022"

LIMIT 100
While the SQL query I generated for data analysis was far beyond beginner-level code, Quadratic’s deep contextual understanding of my data and the ability to write and execute that code within my spreadsheet has prepared my dataset for further insightful analysis in Python. Now that we have this data, let’s analyze it further.
Visualize your data seamlessly
One key limitation of SQL for data analytics is the lack of built-in data visualization capabilities; a limitation Quadratic solves effortlessly. Instead of relying on external BI tools, Quadratic provides a unified environment where users can create interactive visualizations directly from their spreadsheet using different chart types.
All it takes is a simple description of how you'd like your data to be presented. Quadratic’s AI spreadsheet technology automatically generates the Python code to produce interactive charts. This makes Quadratic one of the best data visualization software tools available.
Let’s see how we can create visualizations for our Amazon delivery data. Remember, all you need is a text prompt. For example, to understand the relationship between delivery distances and delivery times, I’ll ask, “Create a scatterplot analyzing delivery_distance_km vs Delivery_Time”.
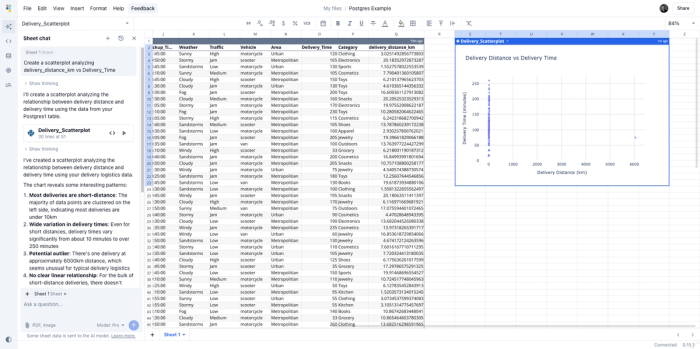
Quadratic’s AI generated Python code within the grid to create a scatterplot data visualization. At first glance, it tells me that there is an outlier in our data–one delivery went over 6,000km in just 75 minutes on a scooter, which can’t be correct. Assuming there was an error in the data recording, we will ask the AI to remove the outlier for more useful analysis. After simply typing “Remove the outlier, and add a trend line”, here’s the resulting chart:
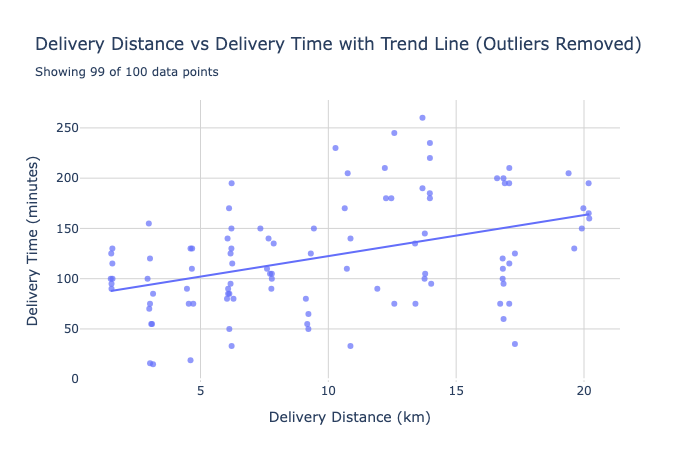
Based on the data visualization, we can determine that there is a base (minimum) time of 20.47 minutes for any delivery, and that each additional kilometer of delivery distance adds another 1.21 minutes to delivery time. Therefore, a 30km delivery would take approximately 56.8 minutes, while factors like traffic and route complexity can cause deviations around 23% of the time.
Conclusion
SQL remains the universal language for querying and interacting with relational databases. Mastering SQL is incredibly valuable, as it allows data analysts to uncover trends, generate meaningful reports, and make data-driven decisions. It’s no surprise that data analysts, scientists, and engineers around the world rely on SQL as a foundational tool in their workflow.
With Quadratic, you don’t need to know how to use SQL for data analysis. It bridges the gap between beginners and advanced users by offering an AI-powered spreadsheet that combines querying, analysis, and visualization in a single browser tab. Beginners can perform powerful data tasks with minimal coding, while experts can bypass repetitive query writing and focus on deeper insights.
In this blog post, we explored SQL for data analysis, the common techniques, and the importance of SQL in data analytics. Whether you're just starting or you have vast experience in SQL, Quadratic brings the future of data analytics even closer. Try Quadratic for free today and experience seamless data analysis with Python and SQL.