
Cole Stark, Head of Growth
Jan 30, 2025

Learning how to create pivot tables is one of the core methods of analysis for Excel users, especially financial analysts, students, and entry-level professionals. However, even experienced analysts often run into pivot table troubleshooting issues, like forgetting how to update a pivot table range or struggling to refresh a pivot table automatically.
If you’re tired of repeatedly updating a pivot table or wrestling with formulas just to answer basic questions (e.g., “What features are our users interacting with the most?”), there’s a simpler way. In this post, we’ll show why pivot table alternatives, particularly AI-powered solutions like Quadratic, can spare you from the hassle of constantly updating data sources and tinkering with table formats.
Pivot table troubleshooting 101: why updates–and pivot tables in general–can be painful
Pivot tables are widely used to quickly group and summarize data tables, but they also come with a host of challenges that can frustrate both beginners and seasoned Excel users. While updating the pivot table is a common sticking point, the pains often begin well before you even get to the refresh stage. Here’s why:
- Complex setup: Creating a pivot table from scratch requires multiple steps: selecting the correct data range, choosing “Insert Pivot Table,” and then mapping rows, columns, and values in the Pivot Table Fields pane. This multi-step workflow can be time-consuming, especially if you only want a simple answer.
- Rigid data sources: A pivot table depends on the data range you specified during setup. If your spreadsheet structure changes, maybe you add new columns or move rows around, you have to manually update the pivot table’s source. Forget this step, and you’ll have stale or inaccurate summaries.
- Manual refresh requirements: Even if your underlying data changes (like a new row gets added for the latest sales record), your pivot table won’t automatically reflect it until you click the “Refresh” button. This manual step leads to frequent “Why is my pivot table not updating?” confusion and can result in outdated reports.
- Reference breakage: If a pivot table is built on a named range or a particular sheet reference, moving or renaming that reference can break the entire table. You’ll suddenly see errors or missing data, forcing you to troubleshoot references just to restore a working pivot table.
- User confusion & steep learning curve: Pivot tables can be intimidating if you don’t use them often. Remembering how to manipulate rows and columns, add filters, or handle multiple levels of grouping can feel overwhelming—leading many to put off or avoid building them altogether.
- Time sink for simple queries: Perhaps the biggest drawback is that pivot tables can be overkill for quick, everyday questions. More on this next.
Why pivot tables are overkill for simple questions
Pivot tables originally became a staple because they could slice, dice, and summarize large datasets in ways plain spreadsheets couldn’t. But for day-to-day queries and last-mile analytics, manually building pivot tables is often too much setup:
- Multiple clicks & menus: Creating a pivot table from scratch involves going to “Insert,” selecting “PivotTable,” choosing a data range, naming fields, etc.
- Constant refresh cycles: You often have to auto-update pivot table options or figure out how you can make a pivot table refresh automatically.
- Formatting & filters: Even after the pivot table is created, adjusting rows, columns, or filters can eat up time.
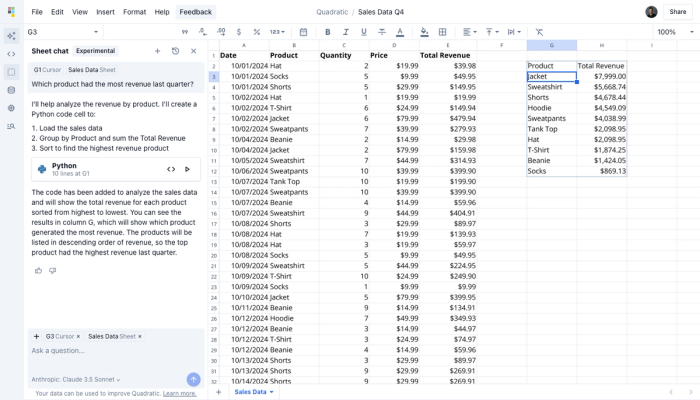
If all you want is a quick answer, these steps can feel cumbersome. That’s where an AI spreadsheet like Quadratic comes in. It allows you to simply ask a natural language question such as, “Which product had the most revenue last quarter?” and get an instant summary without constructing or updating pivot table data ranges manually.
Quadratic: the ultimate alternative to pivot tables in Excel
Looking for an alternative for pivot tables in Excel? Quadratic’s browser-based AI spreadsheet lets you query data as if you were chatting with a colleague:
- No more manual range updates: Instead of clicking through the “Change Data Source” menu, Quadratic automatically detects changes in your spreadsheet.
- Natural language queries: Ask direct questions, e.g., “Show me total sales by region for March”, and Quadratic will generate insights instantly by writing Python code to analyze your data. This alternative to the pivot table approach eliminates the guesswork of which rows or columns to drag where and gives you a method of analysis that you can adapt as necessary.
- Connect directly to your data: Rather than fighting to auto-update pivot tables, Quadratic continuously syncs with databases, APIs, and other 3rd party data sources. No manual refresh needed.
- AI data cleaning: With built-in AI, Quadratic helps you discover trends or anomalies without the initial step of manually cleaning large data sets.
By serving as a pivot table alternative, Quadratic drastically reduces the time it takes to answer routine questions, leaving you more bandwidth for analysis and data-driven decision-making.
Automating the process: forget updating pivot table data ranges
Here’s how Quadratic streamlines what used to be the most painstaking parts of using pivot tables as an alternative to Excel:
- Live data connections: Connect your spreadsheet to a database. Use AI to write SQL queries that pull in only the data you need from your database. Or, use Python or JavaScript to connect to your data via API for live data that refreshes automatically.
- Automatic summaries & data visualizations: Instead of building pivot charts from scratch, Quadratic's AI can generate the best chart or table to represent your query results.
- Collaborative workflow: Share your spreadsheets with teammates and maintain consistent, up-to-date data without “pivot table refresh” confusion.
Conclusion
If you’ve ever Googled “how to update pivot table” or “how to update pivot table range,” you already know the process can feel tedious, especially for straightforward questions like “How many sales per rep this quarter?” By embracing an AI pivot table solution, you skip the manual pivot table troubleshooting that you might experience from Excel or Google Sheets.