James Amoo, Community Partner
Jan 23, 2025

Excel and Google Sheets are the most widely used spreadsheet applications today, offering a range of features to support data analysis, visualization, and advanced calculations. While both data science tools excel at basic spreadsheet operations, each has distinct strengths. Microsoft Excel is better suited for complex data analysis and large datasets, whereas Google Sheets stands out with its user-friendly interface and superior sharing and collaboration capabilities.
Choosing the best spreadsheet application for your project requires understanding the key differences between Excel and Google Sheets, as well as the unique advantages each offers. Comparing their strengths and weaknesses can sometimes be frustrating, leading to a desire for a solution that combines the standout features of both—a third, more versatile alternative.
This blog post will compare Excel vs Google Sheets, examining key factors such as accessibility, performance, AI assistance, pricing, and more. Ultimately, we will discuss how Quadratic might emerge as the superior spreadsheet solution for specific projects and user needs.
Excel vs Google Sheets overview
Microsoft Excel has existed since 1985 and has been the dominant spreadsheet software for decades. It’s one of the many applications in the Microsoft Office suite. Given the evolution of technology and increased requirements in spreadsheet usage over the years, Excel has continually stood the test of time by enhancing existing features and shipping new features to meet the demands of users.
Excel is ideal for tasks such as data analysis, data visualization, and financial data modeling. It also has a robust library of functions and formulas that allow advanced calculations. Excel is widely used by professionals in various roles, including data analysts, accountants, and project managers. Due to this wide adoption, Excel has a vast community of users.
Google Sheets, created by Google in 2006, is a web-based spreadsheet application renowned for its real-time collaboration and sharing capabilities. It allows multiple users in different locations to access and edit files simultaneously, making it an excellent tool for team-based workflows. While not as sophisticated as Excel, Google Sheets provides basic spreadsheet functionalities that cater to everyday tasks. The simplicity and collaboration-focused design make it ideal for casual users and teams prioritizing seamless teamwork.
Accessibility
Microsoft Excel: Excel is a desktop-based spreadsheet application, which means a manual installation is required. However, Microsoft launched an online version of Excel in 2010. The online version has fewer features and cannot perform complex calculations like the desktop version. Being desktop-based, users can access Excel’s full functionality even when they are offline.
Google Sheets: Google Sheets is a web-based application that can be accessed from any device with an internet connection. It’s relatively easier to use Google Sheets as it does not require installation, its full functionalities are available online. Plus, users are able to manually set documents as available offline for editing without internet connection.
The major difference between Excel and Google Sheets is the manner of accessibility. If you’re looking for an easily accessible online spreadsheet, consider Google Sheets.
Collaboration
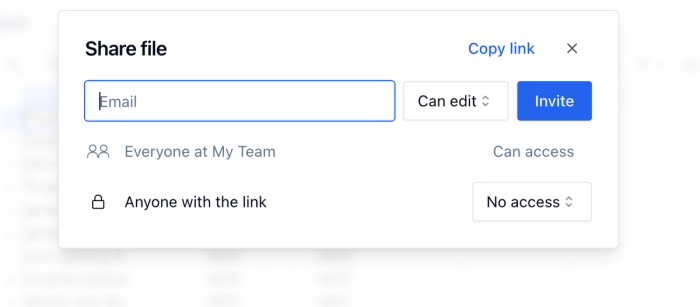
Microsoft Excel: Collaboration in Excel is not straightforward as it often requires additional setup. Even with that, users might face version control issues as the desktop Excel is an application that resides on one’s local computer. To collaborate, you typically need to save the file to OneDrive or SharePoint and share it with others. While Microsoft Excel 365 offers online collaboration, it is less commonly used due to its more limited features compared to the robust desktop version.
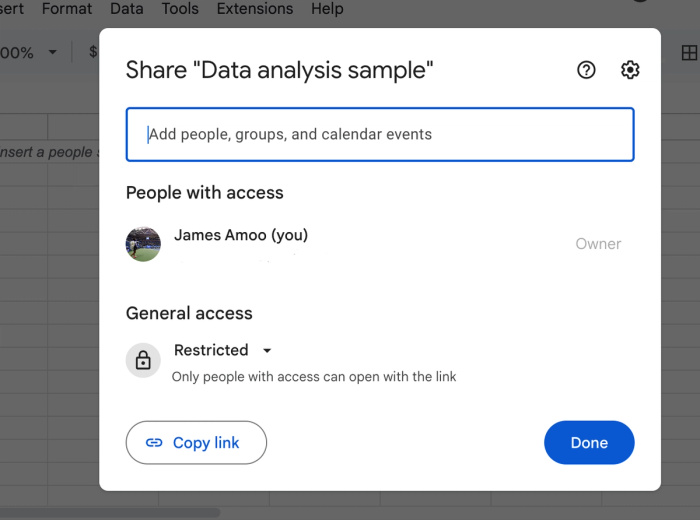
Google Sheets: For users who prioritize teamwork, the ease of collaboration is what makes Google Sheets better than Excel. Teams can access, edit, comment, and track changes made by others in real-time, fostering a highly interactive and efficient workflow. As remote work becomes increasingly common, this level of collaboration has become indispensable for many organizations.
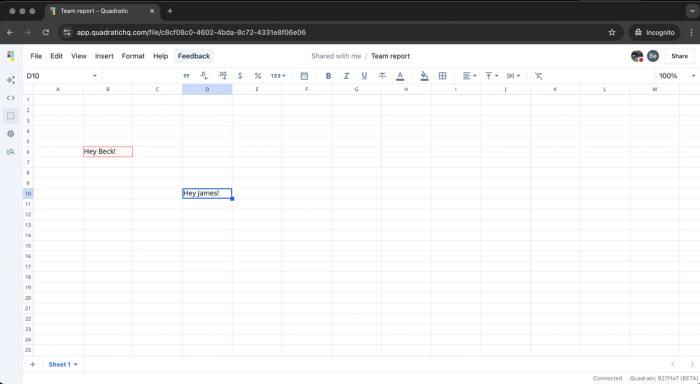
Quadratic also leverages the power of teamwork by providing a collaborative environment where users can make changes in real-time and generate insights simultaneously.
Here’s an example of simultaneous collaboration in Quadratic:
Native support for programming languages
Microsoft Excel: Excel does not have native support for directly coding in modern languages. Although you can manually add the Python integration from the Formulas tab. Once activated, you can write Python formulas within a cell or in the formula bar, much like coding in an editor. Currently, the Python in Excel feature is available exclusively for Windows users with an active Microsoft 365 subscription.
Google Sheets: Google Sheets also does not natively support languages like Python, so additional setup is required. Typically, you have to create a new project in Google Cloud Console, enable the Google Sheets API, install the necessary Python libraries, and then configure account credentials for authentication. This setup allows your Python application to interact with Google Sheets through the API.
Support for modern languages is one aspect that does not have a clear winner when exploring Google Sheets vs Excel. Quadratic excels in this area with native support for modern programming languages such as SQL, JavaScript, and Python. Whether you prefer writing code or utilizing traditional spreadsheet formulas, Quadratic’s integrated spreadsheet code editor caters to users with varying skill levels.
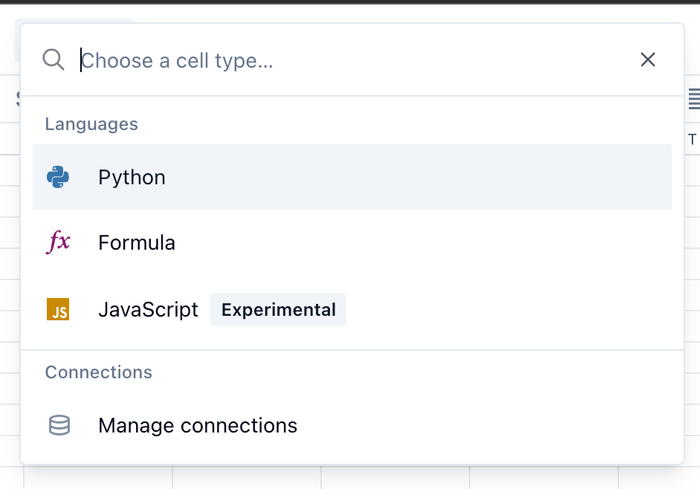
Quadratic also comes with pre-installed Python libraries like Pandas, Numpy, SciPy, and Plotly, offering more flexibility in performing tasks.
Performance
Microsoft Excel: Excel is designed to handle large datasets, supporting up to 1,048,576 rows by 16,384 columns. If a dataset exceeds this limit, Excel loads data up to the cell limit and truncates the rest. It processes datasets more efficiently than Google Sheets, although performance depends on the CPU and RAM of the local computer. This high performance is specific to the desktop version of Excel; the online version, Excel 365, is less suited for managing large datasets due to its limited capabilities. For optimal results with extensive data, the desktop version of Excel is the best choice.
Google Sheets: Google Sheets supports up to 10 million cells per spreadsheet, which is sufficient for basic operations and small datasets. However, performance begins to decline with larger datasets and can noticeably lag beyond 1,000 rows. Compared to Excel, Google Sheets falls significantly short in handling large datasets and executing resource-intensive tasks efficiently.
Depending on your data size, you can choose either Google Sheets or Excel. Quadratic is also well suited to handle large datasets as it’s built on modern web app architecture tools like WASM, WebGL, and Rust.
AI assistance
Microsoft Excel: Microsoft integrated the Microsoft 365 AI Copilot with Excel in 2023, utilizing Open AI’s GPT models. This feature offers AI assistance in generating formulas, charts and, formatting, enabling users to get insights through natural language queries. Excel being AI-powered offers a massive productivity boost as users can automate repetitive tasks, perform data cleanup, and generate predictive models.
Google Sheets: Google Sheets does not provide a dedicated copilot but it offers AI-powered features like smart fill, smart suggestions, and formula corrections. Google Sheets also allows the installation of AI tools as add-ons, enabling users to leverage the AI features of these tools. Popular AI tools include Gemini for natural language queries, Simple ML for machine learning tasks, and Power Tools for data manipulation tasks.
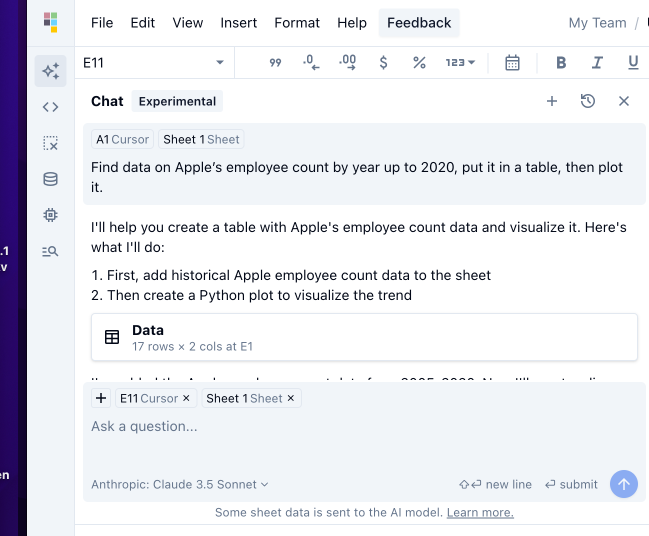
Quadratic, on the other hand, integrates AI directly into its spreadsheet interface, eliminating the need to install multiple non-native AI tools for data analysis. It allows users to extract meaningful insights and conduct advanced analysis of their data with natural language queries. Quadratic's code generation capabilities are enhanced by its native support for modern languages like Python, SQL, and JavaScript, resulting in more accurate and tailored code for data analysis. Here’s how it looks:
Data analysis and visualization
Microsoft Excel: As mentioned earlier, Excel is well suited for complex data analysis and advanced calculations given its wide range of formulas — you can say that’s its biggest superpower. Users tackling intricate data sets can harness the power of its extensive function library, encompassing statistical, engineering, and web functions.
Key tools like what-if analysis, updating pivot tables, and statistical tests streamline data manipulation. Excel also provides a variety of charts and graphs for basic and complex visualization. A notable feature in Excel that helps with visualization is the “Recommended Charts” functionality, which intelligently suggests the most suitable chart type for any given dataset.
Google Sheets: Google Sheets performs satisfactorily well for basic data analysis and visualization tasks. Compared to Excel, it lacks advanced data analysis features like statistical functions and complex formulas. Google Sheets provides charts and graphs to aid visualization but they're not as extensive as Excel and cannot be used to perform advanced visualization tasks. It does not offer the innovative “Recommended Charts” feature, which may seem unnecessary but is super helpful when you try it out.
Quadratic streamlines complex data analysis and visualization, accelerating the transformation of raw data into actionable insights. It serves as a centralized platform where users can seamlessly view, manipulate, analyze, and visualize data from multiple sources, enabling faster and more informed decision-making.
Learning curve
Microsoft Excel: Given the variety of features and wide range of formulas available, it might take some time for beginners or non-technical users to get acquainted with Excel. However, based on the experience of many users, it becomes friendlier with consistent usage.
Google Sheets: Google Sheets adopts a friendlier and relatively minimalistic interface since it does not provide as many features as Excel. It’s well suited for beginners and non-technical users.
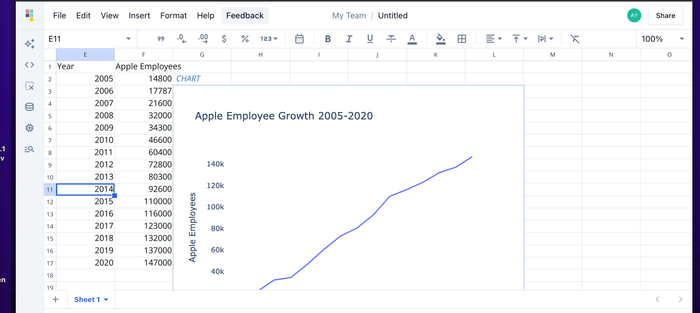
Based on the learning curve and ease of use, Google Sheets is the best choice if you’re in search of a friendly interface and not looking to perform complex tasks. You may also want to consider Quadratic if you’re in search of a friendly interface. Here’s how the Quadratic interface looks:
Pricing structure
Microsoft Excel: At the time of this writing, the desktop version of Excel has a flat fee of $179.99 and is limited to only one device. The online version is subscription-based and costs $6.99 per month for individual use (to access its premium features).
Google Sheets: Google Sheets is free for individual use and costs $6.99 per month for business use.
Quadratic is also free for individual use and has a plan for teams of over 3 users that costs $15 per month (billed annually). This plan allows you to access a shared team workplace, unlimited sharing functionality, and unlimited AI usage.
Quadratic: the best spreadsheet application for your project
Is Excel better than Google Sheets for your project? While both Google Sheets and Excel offer valuable features, they each have their limitations. If you’re looking for an alternative that also offers key spreadsheet features, you can consider Quadratic. What can Excel do that Google Sheets can’t? Consider the table below that summarizes how the spreadsheets compare using the factors discussed earlier:
| Excel | Google Sheets | Quadratic | |
|---|---|---|---|
| Accessibility | Manual installation is required | Can be accessed from any device with an internet connection | Does not require manual installation as it is web-based |
| Collaboration | Requires additional setup | Seamless collaboration | Seamless collaboration |
| Native support for programming languages | No | No | Yes |
| Performance | Can handle large datasets | Slows down with large datasets | Can handle large datasets |
| AI assistance | Native support | Non-native support | Native support |
| Data analysis and visualization | Suited for complex analysis and visualization | Not suited for complex data analysis and visualization | Suited for complex analysis and visualization |
| Learning curve | Steep | Shallow | Shallow |
| Pricing | $179.99 flat fee | Free for individuals, $6.99/month for business use | Free for individuals, $15/month for teams |
Conclusion
Having explored Excel vs Google Sheets, the optimal choice heavily depends on the specific needs of your project. Excel is better at advanced data analysis tasks while Google Sheets facilitates seamless collaboration within teams.
Quadratic, however, emerges as a compelling alternative by seamlessly combining key features of both Excel and Google Sheets. It empowers users to perform advanced calculations, enables effortless team collaboration, and facilitates the use of modern programming languages. Even better, Quadratic provides a unified platform to access, edit, analyze, and visualize data from diverse sources. If you’re looking for a good alternative to Excel and alternative to Google Sheets, feel free to try out Quadratic for free.