James Amoo, Community Partner
Dec 19, 2025

Modern spreadsheets have become powerful and enjoyable to work with, but it wasn’t always this way. For many years, analysts used traditional tools like Excel and Google Sheets, which offered little to no support for true automation.
Most tasks had to be done manually: cleaning data, refreshing reports, updating dashboards, and running the same formulas repeatedly. And if you wanted to automate any of that, you had to either learn complex formulas or dive into VBA or Apps Script, both of which required technical expertise and were painfully time-consuming to set up.
This created a bottleneck in accessibility to data and the ability to self-serve analytics. Automation was only accessible to analysts who had the time and patience to script everything by hand, but this is no longer the case.
The advent of modern spreadsheets has revolutionized automation, data accessibility, and the ease of generating insights. They combine the familiarity of classic spreadsheet interfaces with the sophistication of built-in automation, SQL, Python, and even autonomous AI agents. With just a few natural-language instructions, analysts can now automate data refreshes, generate recurring reports, keep dashboards up to date, and even run end-to-end analysis workflows automatically.
This shift has made spreadsheets more convenient and transformed how analysis gets done. Automations run in the background. AI cleans data before you even ask. Agents generate visualizations, analyze trends, and build workflows that would have taken hours, if not days, in traditional spreadsheets.
In this blog post, we’ll explore how modern spreadsheet automation elevates the entire data analytics lifecycle. From hands-free data updates and automatic report generation to agentic analysis that delivers insights faster and more accurately.
Traditional methods of spreadsheet automation
If you’ve ever tried to build automation in traditional spreadsheets like Excel or Google Sheets, you know how challenging the process can be. In the early days of analytics, this complexity was tolerated. Data volumes were smaller, reporting cycles were slower, and real-time insights weren’t yet a requirement. These tools felt “good enough” because the demands were simpler.
Today’s analytics environment is completely different. Teams now work with larger datasets, tighter timelines, and higher expectations for speed, accuracy, and collaboration. Traditional spreadsheets simply weren’t built for this reality, and definitely not for the future of data analytics.
Excel offered macros and VBA (Visual Basic for Applications) to automate repetitive tasks. For its time, this was groundbreaking. Analysts could record actions, build custom functions, and automate entire workflows. While macros paved the way for automation, they remained inaccessible to many analysts due to its requirement for technical expertise. This slowed down the process of generating insights and communicating results.
Google Sheets came into the picture and pushed automation a step forward. It introduced features like connected data sources, data validation, scheduled refreshes, and real-time collaboration. For more advanced automation, analysts could turn to Apps Script, a JavaScript-based environment that enables custom functions, API calls, and event-driven workflows. This made Google Sheets ideal for lightweight dashboards and shared operational tools. Its integration with Google Workspace also made automations easier to distribute across teams.
But even with these improvements, automation remained limited by scripting complexity, performance constraints, and a lack of built-in analytical capabilities.
Spreadsheet automation: why traditional spreadsheets won’t scale
Here’s the truth: modern data needs are increasing, and traditional spreadsheets can hardly cater to these technical demands.
First, automation using traditional spreadsheets requires technical expertise. Setting up macros, VBA scripts, or Apps Script functions means writing and debugging code, maintaining it over time, and understanding how the spreadsheet’s internal structure works. This instantly excludes non-technical users and places a heavy burden on the few who can script.
Even worse, these automations are fragile. A minor change like renaming a tab or moving a column can break the entire workflow. This leads to scripts failing silently and analysts having to spend time troubleshooting instead of analyzing.
Traditional spreadsheets also struggle to handle large or complex datasets. As data volumes increase, files become slow, formulas are recalculated endlessly, and automations take longer to run (or time out entirely). Integrating multiple data sources or enabling real-time updates pushes these tools beyond their intended limits.
Also, these solutions lacked native support for modern analytical tools. They weren’t built to run SQL queries directly inside the sheet, execute Python code for deeper analysis, or use AI for tasks like cleaning or transformation. While these capabilities weren’t always necessary in the past, they’ve become critical to keeping up with today’s analytical workflows.
AI-powered spreadsheet automation
AI spreadsheet automation tools solve many of the frustrations that come with traditional spreadsheets. These modern tools introduce automation that’s driven by intelligence rather than manual setup. They move far beyond SUMs, IFs, and deeply nested logic, bringing spreadsheets into a stage where automation is powered by AI and accessible to anyone.
Modern spreadsheets include models that understand the context and structure of your dataset, allowing them to automatically carry out tasks that would normally take hours or days. This includes duplicate removal, format standardization, error detection, and other data preparation tasks.
Beyond cleaning, AI-powered spreadsheets also offer features for data preparation. They can detect anomalies, highlight trends, and even analyze the entire dataset to generate summaries on demand. All of this can be done through natural language queries, allowing analysts to simply describe what they want done and get the results instantly. Instead of wrestling with syntax or formulas, they can use text prompts to generate insights from their data.
With AI-powered spreadsheets, analysts can spend less time performing repetitive tasks and focus more on analyzing their data to generate insights. These automated spreadsheets are built to save time, improve accuracy in results, and facilitate collaboration across teams so that other members can access and contribute seamlessly.
Quadratic: the automated spreadsheet software for modern analytics
Quadratic is an AI-powered spreadsheet built for the realities of modern data workflow. Unlike traditional tools that depend on formulas or scripting, having to learn Python or knowing how to create a dashboard, Quadratic gives you powerful automation through natural language instructions. You can clean datasets, run analyses, generate visualizations, and transform data simply by describing what you want to do.
Quadratic also connects directly to multiple data sources, allowing you to pull in live data and start working with it instantly. It’s one of the few AI spreadsheet automation tools that lets you automate every step end-to-end, making your processes accessible to non-technical users, technical users, and citizen developers. Being a collaborative analytics platform, it allows you share insights to your team members in real time.
AI agents for automation and analysis
Quadratic lets you use AI agents to handle data analysis and automation. After setting them up (no technical expertise required), these agents can independently execute tasks such as data cleaning, report generation, and even predictive analytics. They continuously monitor your datasets for updates and automatically perform the necessary actions, meaning you don’t need to press a button or trigger a workflow manually.
With new data constantly flowing in from multiple sources (clean, stale data, or somewhere in between), these autonomous agents ensure everything is transformed and ready for analysis without manual intervention. Even though analysts don’t have to write code or scripts to automate their workflows, Quadratic still generates the underlying code for every automated task. This gives analysts full visibility into how the automation works and provides a method they can review, modify, and reuse. Here’s an example of how you can automate data cleaning:
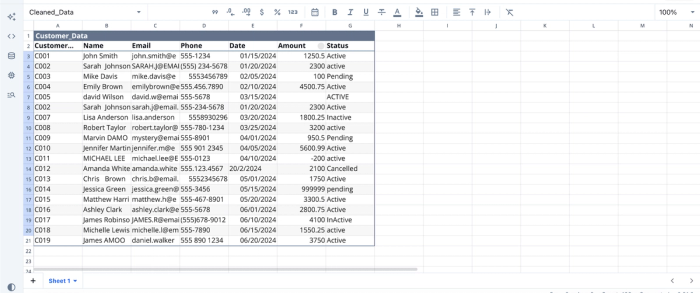
Here, we have some sample data loaded into Quadratic’s interface. To automate data cleaning in this dataset, all you have to do is prompt Quadratic AI to clean the dataset. Here:
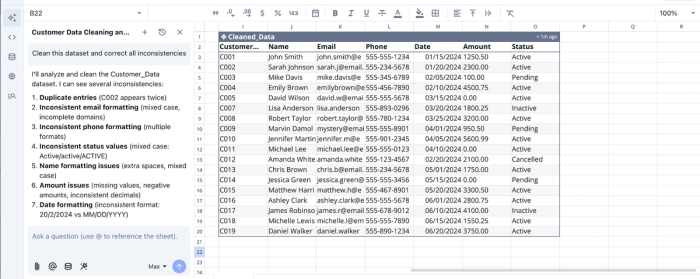
Quadratic generates a separate table containing the cleaned version of your data, without requiring you to repeatedly re-prompt or run the process manually. Once your cleaning and validation steps are defined, the AI agent automatically applies them whenever new data flows in. This means every future update is processed accurately without manual effort.
Native support for modern programming languages
Quadratic provides an all-in-one coding spreadsheet where analysts can work with modern programming languages directly alongside their spreadsheet data. Technical users gain full control over their analytics and can build highly customized automations when needed.
With native support for Python, SQL, and JavaScript, Quadratic lets you choose the workflow that best fits your needs, whether you're using AI for data analysis or automating tasks using Python and SQL. Here’s the code equivalent of the automation we conducted earlier:
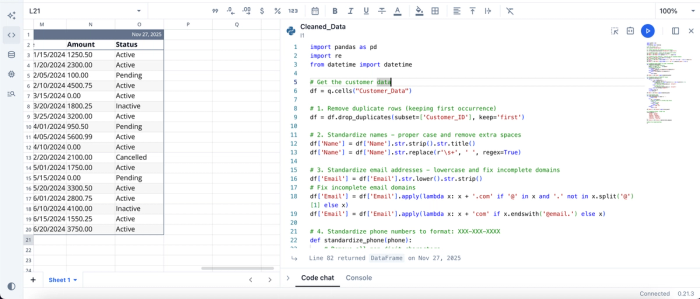
Users can modify the code and see updates to their data in real time.
Automating spreadsheets for data visualization
Creating interactive visualizations is often a challenge for analysts, especially when most spreadsheet tools don’t support charting within the same environment. This forces teams to export data into separate BI, data visualization tools, or manually chart with SQL.
Quadratic eliminates that friction by enabling you to generate and automate visualizations directly inside the spreadsheet. Just describe how you want your chart to look in a simple text prompt, and Quadratic handles the rest. With built-in support for Plotly and Chart.js, it can produce a wide range of interactive visualizations using different chart types. Suppose we have a sample product data:
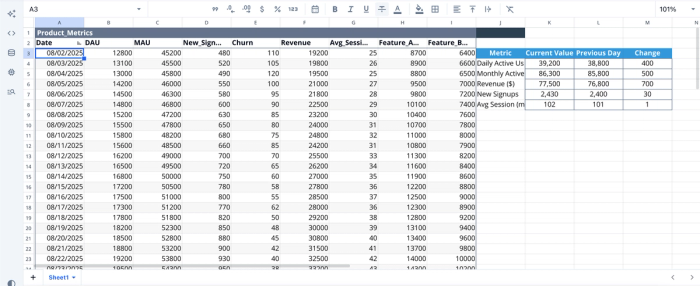
By simply prompting the AI to “Create a revenue and MAU/DAU chart,” I was able to generate automated visualizations for both metrics. Here’s the result:
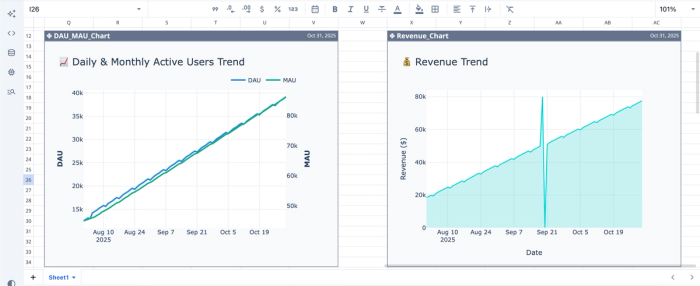
These charts update instantly whenever the underlying data changes. Quadratic also makes it easy to create marketing data visualizations that display all your key metrics in a live dashboard.
Conclusion
The rising complexity of modern analytics workflows is pushing analysts to look beyond traditional spreadsheets toward tools that can streamline and automate routine tasks. Spreadsheet automation tools allow analysts to focus on generating insights rather than manually combing through thousands of rows.
In this blog post, we explored what spreadsheet automation is, why legacy spreadsheet systems increasingly fall short, and how AI-driven automation platforms like Quadratic are reshaping the future of data analytics. Try Quadratic for free today.
Frequently Asked Questions (FAQs)
What are the best finance tools for automation replacing spreadsheets?
Tools like Quadratic, Vena Insights, and Trullion are the best finance tools to use as a replacement for spreadsheets. These tools help you gain financial insights from your data without writing complex formulas or code.
Can I automate spreadsheets with Python?
Yes, you can automate spreadsheets with Python. Modern AI-powered spreadsheet tools like Quadratic make this even easier by providing native support for Python, SQL, and JavaScript directly inside the spreadsheet environment. This allows you to run scripts and automate complex tasks without leaving the sheet.
How can I automate Excel spreadsheets?
Automating Excel spreadsheets requires knowledge of VBA (Visual Basic for Applications). This can be used to automate tasks like data cleaning, report generation, and dashboard updates.
What data sources can be connected to automated spreadsheets?
It depends on the tool. Tools like Quadratic can connect to a variety of data sources, including databases (SQL, BigQuery), cloud storage, raw data, and APIs.
What tasks can be automated in Google Sheets or Excel?
Common automations include data cleaning, deduplication, formatting, scheduling imports, sending reports, and building dashboards.