MJ Lindeman, PhD, Community Partner
Nov 12, 2025

Table of contents
Python dashboards used to mean weeks of writing Plotly code, configuring Flask deployments, and maintaining infrastructure. When you wanted to create a dashboard in Python, you'd spend more time on boilerplate than on analysis. However, modern Python dashboard development is completely different. AI generates the code, live database connections eliminate data exports, and browser-based execution makes deployment simple. What took weeks now takes minutes.
This shift from code-heavy to AI-augmented changes who can build a dashboard in Python and how quickly dashboards go from idea to production. Instead of focusing on implementation details, you can focus on the questions you want answered. The AI handles syntax, the platform manages infrastructure, and you get direct insights. Here's how these pieces work together.
From code-heavy implementations to AI-augmented workflows
Traditional Python dashboards involved writing data loading logic, cleaning and transforming dataframes, constructing visualization objects with dozens of parameters, configuring layouts, and handling edge cases. A simple sales dashboard might require 200+ lines of code before the first chart appeared.
Modern approaches flip this model by shifting from writing input as procedural code to expressing the user’s intent in natural language. This change is driven by the rise of sophisticated large language models (LLMs) and natural language processing, which allow a user to focus on the "what" of the analysis rather than the "how." Instead of having to meticulously script every action, the user simply states the desired end state or business question.
For example, when working in Quadratic, you describe what you want to see and the AI generates the working code. Instead of writing df.groupby(['month', 'category']).agg({'revenue': 'sum'}).reset_index() in pandas (Python), you ask "show me monthly revenue by product category." The AI provides the functioning code that handles the aggregation, formatting, and visualization. The code remains visible and can be edited, but you start from working implementations rather than blank cells.
This evolution matters because it removes the barrier between analytical thinking and visual output. When you notice an interesting pattern and want to explore it further, you ask a follow-up question rather than searching documentation for the right method signature. Your cognitive flow stays focused on the data story you're building instead of breaking for implementation research.
The AI assistance extends beyond simple queries to complex analytical tasks. You can request statistical models, multi-step transformations, or sophisticated visualizations without knowing the specific libraries or methods required. Ask for "a regression model showing which factors predict customer churn, with feature importance ranked," and the AI generates scikit-learn code that prepares data, fits the model, and visualizes results. You can review the approach, adjust parameters, or modify the methodology because the code sits in editable cells.
This doesn't eliminate the need to understand data analysis. It shifts your effort from Python syntax and implementation mechanics to problem framing and result interpretation. You still need to know what questions to ask, which analyses make sense for your data, and how to evaluate whether results are meaningful. The AI accelerates the translation from analytical intent to working code. You still do the thinking about what analysis to perform, or you ask the AI for help with that. Or, simply ask the AI to create a Python dashboard analyzing different relationships in your data with exploratory data analysis.
The compound effect changes project timelines dramatically. Tasks such as exploring data, testing different visualization approaches, and building multiple model variations can now be done in hours rather than days. You can iterate faster, try more alternatives, and refine presentations until they communicate clearly. The time savings come from eliminating implementation friction, not from shortcuts that sacrifice quality.
Connecting SQL databases to live Python environments
Traditional dashboarding in Python started with data extraction. You'd export CSVs, download them locally, write pandas code to load and clean them, then begin analysis. By the time you finished the dashboard, the data was stale. Modern platforms connect directly to databases and maintain those connections live.
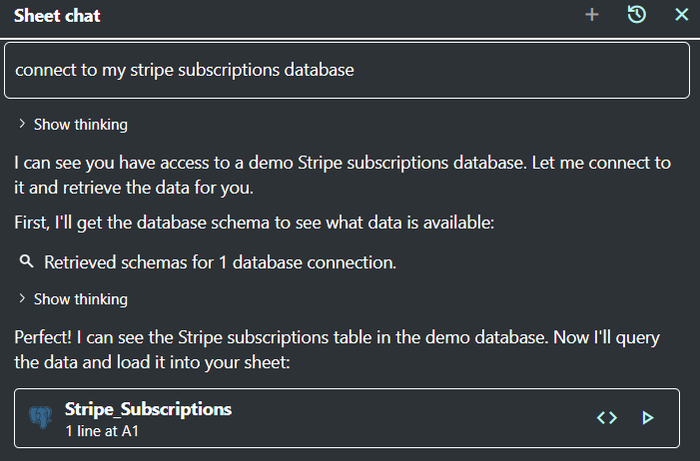
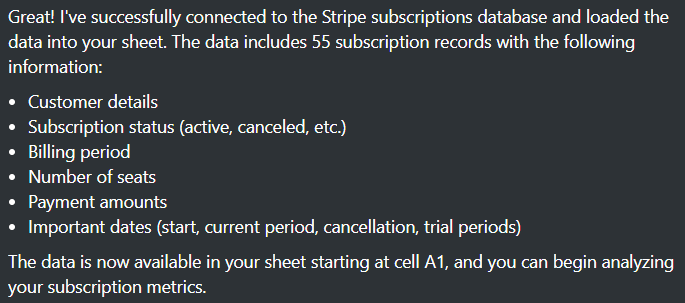
In contrast, the simple prompt "connect to my stripe subscriptions database" to Quadratic's embedded AI automatically connected to the Stripe database (Figure 1). The AI described the data fields in its text response, shown in Figure 2. It also placed the data in a table on Sheet 1, ready for analysis. There was no manual SQL writing, no data exports, and the data was immediately available for analysis.
Quadratic authenticates to Postgres, Snowflake, MySQL, and Supabase through secure connections that persist in your spreadsheet. When you ask the AI to query your database, it generates appropriate SQL, executes it against your production data, and returns results as pandas DataFrames. Those DataFrames populate immediately in cells, ready for Python analysis. The connection stays active, so reopening the sheet or sharing it with colleagues means they see current data without manual refreshes.
This architectural change eliminates the extract-transform-load (ETL) cycle that plagued traditional workflows. Your Python code operates on live data. Metrics update automatically when the underlying data changes. For example, you might query the last 30 days of user activity. That query re-executes each time someone opens the sheet, so the "last 30 days" always reflects the current date without modifying code or scheduling refresh jobs.
The security model matters here. Database credentials are encrypted and remain server-side. You authenticate once during connection setup, and the platform handles subsequent query execution securely. This avoids the common problem of database passwords scattered across notebook files or environment variables that get accidentally committed to repositories.
Live connections also enable interactive Python dashboard features that weren't practical with static exports. Users can adjust date ranges, filter categories, or drill into specific segments, and queries re-execute automatically. The data dashboard Python responds to interactions by fetching current data rather than displaying pre-calculated snapshots.
Using AI to generate charts and models automatically
The transformation from code-heavy to AI-augmented shows most clearly in chart generation. Traditional Python dashboard development meant looking up Plotly documentation, figuring out the right chart type, configuring axes and legends, styling elements, and debugging rendering issues. Each chart might take 30-60 minutes to get right.
AI changes the workflow completely. You describe what you want to see: "Show revenue trends over time with annotations marking major product launches." The AI selects appropriate chart types, generates code that formats data correctly, applies sensible defaults for colors and styling, and handles edge cases like missing values or date formatting. The resulting code appears in editable Python cells, so this isn't a black box. You can see exactly how the visualization was constructed and modify any aspect.
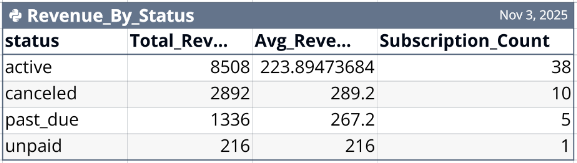
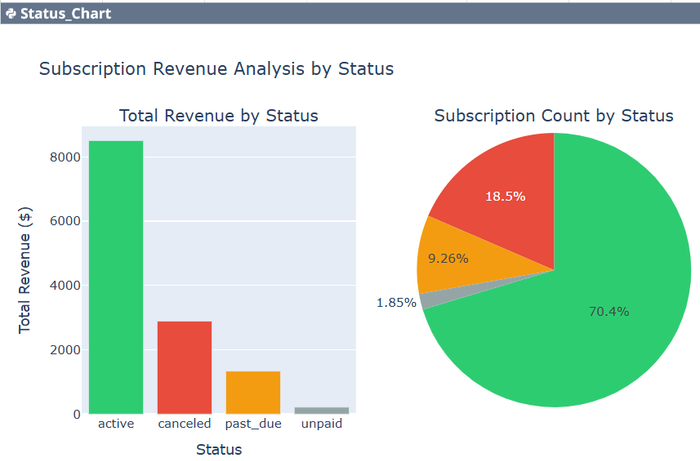
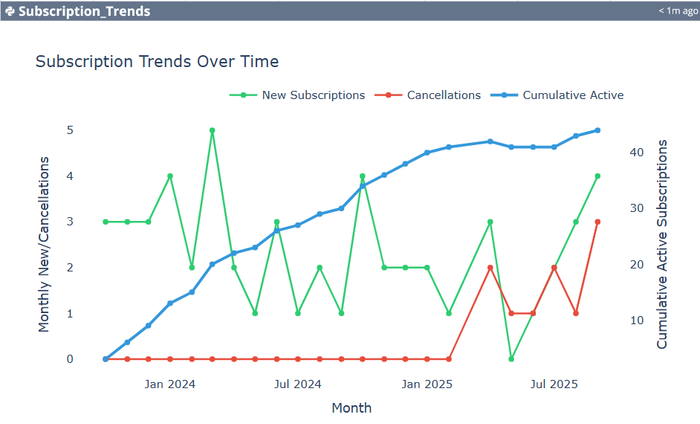
At the bottom of the previous example, the AI suggested three additional analyses: (1) Analyze revenue by subscription status, (2) Create subscription trends chart, and (3) Calculate key subscription metrics. The simple request, "Do all three," yielded the results shown in Figures 3-6. Again, an input of three words replaced having to write the Python code to get the table of results with two charts. The AI did the three complex analyses in seconds, and the code can be edited by the user.
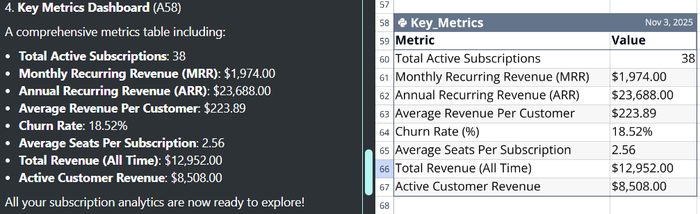
The AI also provided a Key Metrics Dashboard (Figure 6), which is the focus of this post. The AI created this tabular dashboard without being asked to do so. It knew the dashboard would be a helpful table to go with what had been requested by the user. This is an example of the collaborative mode of AI that goes beyond what the user specifically requests.
The AI automatically puts the important fields on the dashboard. The comprehensive metrics it chose were:
- Total Active Subscriptions: 38
- Monthly Recurring Revenue (MRR): $1,974.00
- Annual Recurring Revenue (ARR): $23,688.00
- Average Revenue Per Customer: $223.89
- Churn Rate: 18.52%
- Average Seats Per Subscription: 2.56
- Total Revenue (All Time): $12,952.00
- Active Customer Revenue: $8,508.00
This is important for building dashboards in Python because you can iterate rapidly. You can change the Python code to do what you want, or you can ask the AI to make the changes. Either way lets you get the results you want within minutes, if not seconds.
Try a line chart, decide that a bar chart shows patterns more clearly, and switch to a heatmap for the detailed view. Each iteration is very quick. You can experiment until you find visualizations that communicate your insights effectively.
Model generation follows similar patterns. Instead of importing libraries, preparing feature matrices, configuring estimators, and fitting models manually, you describe the analysis you want. "Build a logistic regression predicting churn based on usage metrics and show which features matter most." The AI generates code that encodes categorical variables, splits data appropriately, fits the model, and creates visualizations of feature importance and model performance.
The generated code uses standard libraries like scikit-learn, so you're not locked into proprietary approaches. You can examine methodology, adjust hyperparameters, try different algorithms, or extend the analysis. The AI provides a working starting point that handles boilerplate, while you retain full control over the analytical approach.
For data visualization dashboard Python projects, this means you can create a dashboard in Python that includes sophisticated analysis without deep expertise in every library. Need time series forecasting? Ask for it. Want clustering analysis? Request it. The AI handles implementation details while you focus on whether the analysis answers your questions and how to present findings clearly.
The dashboard can be built using dataframes from different physical sources. This data blending becomes particularly powerful for creating a dashboard in Python that needs a comprehensive view. Your customer behavior data lives in one place, operational metrics in another, and financial data in a third. Combining data lets you create unified analyses without moving data into centralized warehouses or building permanent integration pipelines. The connections remain live, so combined analyses stay current as any source updates.
The AI spreadsheet environment makes data blending intuitive. Different queries populate different areas of the sheet. Python code references those cells to combine data as needed. This spatial organization makes complex multi-source analyses more comprehensible than linear notebook flows where everything scrolls together.
Deploying interactive dashboards in your browser
Traditional Python dashboard examples involved deployment complexity that rivaled the analytical work. You'd containerize applications, configure hosting, manage dependencies, set up authentication, and maintain infrastructure. Small teams often could not justify this overhead for internal dashboards, so they shared static exports instead.
Browser-based platforms that create a dashboard in Python eliminate deployment entirely. Your dashboard exists as a shareable link. No Docker containers, no server configuration, no dependency management. You build the dashboard, share the URL, and recipients see the live version immediately. No pip installations, no environment setup, no "works on my machine" debugging.
The execution model handles complexity server-side. When someone opens your dashboard, their browser connects to a Python kernel that runs your code. Charts render interactively using Plotly, and the infinite canvas layout lets you arrange visualizations spatially. You might put overview metrics at the top, detailed breakdowns to the right, and filtering controls on the left. You decide the layout that clearly communicates your analysis.
Collaboration happens in real-time. Multiple people can view the same interactive dashboard in Python simultaneously. If you adjust a parameter or update an analysis, everyone sees changes immediately. This creates a shared analytical workspace where your data lives next to your charts, rather than isolated files passed through email or Slack. Comments and discussions attach directly to specific visualizations or code cells, keeping feedback contextual.
The browser-based approach also means dashboards work on any device. Open the link on your phone during a meeting and you have access to the same interactive visualizations, complete with drill-down capabilities. Computational complexity happens server-side, so device limitations don't restrict functionality.
Making Python notebooks collaborative and real-time
Traditional Jupyter notebooks exist as files on individual computers. Collaboration meant exporting to HTML or PDF and sharing static versions. Updates required downloading new files, and there was no way to see what changed without careful comparison. This workflow broke down for Python dashboards that needed to stay current or serve multiple stakeholders.
Quadratic treats dashboards as collaborative documents. Changes appear immediately for everyone viewing the sheet. Update a SQL query or modify Python code, and colleagues see new results without refreshing. Version history tracks who changed what and when, with the ability to revert if needed. This removes the fear of experimentation because you can try different approaches, knowing you can always return to what worked before.
Quadratic’s infinite canvas supports collaborative work better than linear notebooks. You can organize information spatially rather than sequentially. Put executive summary visualizations in one area, detailed analysis in another, and working hypotheses in a third. Team members navigate to relevant sections rather than scrolling through hundreds of cells. This spatial organization makes complex analyses more browsable and easier to update without disrupting existing work.
Real-time data connections mean the data dashboard Python stays current automatically. Open the sheet in the morning and you see yesterday's data. Share it in a meeting and everyone views identical information. This eliminates "which version are we looking at" confusion that plagues emailed exports or static files.
For teams building dashboards in Python, this collaborative model changes workflows fundamentally. Analysts can build initial dashboards, stakeholders can explore interactively and ask questions inline, and analysts can iterate based on feedback, and do it all in the same shared space. The transparency of seeing code and data together helps non-technical stakeholders understand methodology, while making it easy for technical users to verify approaches.
What this means for your workflow
The shift from code-heavy to AI-augmented Python dashboard development removes barriers between questions and answers. You can connect directly to production databases, generate sophisticated visualizations through natural language, blend data from multiple sources, and share interactive results instantly. The technical complexity gets handled by infrastructure and AI assistance, letting you focus on what the data reveals.
This matters most when you need to answer questions quickly or keep stakeholders informed without constant manual updates. The creation of a dashboard in Python goes from weeks to hours. The time difference changes what's possible. You can explore more hypotheses, test different analytical approaches, and refine presentations until they communicate clearly.
Starting with modern dashboarding in Python doesn't require abandoning existing skills or learning entirely new tools. The Python code remains standard pandas, Plotly, and scikit-learn. You gain AI assistance for generation and browser-based infrastructure for deployment, but the underlying analytical approaches stay familiar. Try it with a real project. Connect your database, describe what you want to see, and experience how much faster you can go from question to dashboard to actionable insights.