James Amoo, Community Partner
Dec 19, 2025

If there’s one thing every data analyst should know, it’s the fact that dirty or stale data can lead to bad insights. You can spend hours running models, building dashboards, and exploring patterns, yet still reach the wrong conclusions simply because your underlying data wasn’t clean.
As organizations now operate in a world of streaming data and constant decision cycles, manual data preparation becomes a bottleneck. It’s error-prone, difficult to maintain, and nearly impossible to scale across teams with different levels of technical expertise
To navigate this transition into the future of data analytics, analysts must move past manual scripting and ad-hoc spreadsheets and embrace AI-powered data wrangling that is designed for speed or scale of modern analytics.
In this blog post, we’ll discuss the transition of data wrangling from manual wrangling to intelligent preparation to cater to modern data needs. We’ll also explore the top data wrangling tools at the forefront of this transition and see how they help in your workflow.
What does data wrangling entail?
Data wrangling is the process of transforming raw data into a format that is suitable for analysis. It’s a critical step in the analytics workflow, ensuring that any insights drawn are accurate and reliable. Beyond simply cleaning errors or removing inconsistencies, data wrangling also involves essential data preparation tasks such as transformation, validation, enrichment, and publishing.
To support this process, data wrangling tools are designed to automatically convert messy data into high-quality datasets. These tools can clean and prepare large volumes of data in a fraction of the time manual processes would take. As datasets continue to grow, choosing the right data wrangling solution becomes increasingly important for businesses aiming to maintain data integrity and generate trustworthy insights. Steps involved in data wrangling include:
- Collection: This stage involves identifying the data you need, understanding where it comes from, and determining the best way to acquire it.
- Cleaning: After collecting the data, the next step is to remove inconsistencies like missing values, duplicates, formatting issues, and invalid entries.
- Enriching: Enrichment adds meaningful context to your data. This may include integrating external data sources or supplementing existing fields to improve overall quality and analytical value.
- Validation: Validation ensures that the data meets the required standards for accuracy and consistency, confirming that it’s ready for analysis.
- Publishing: The final stage is publishing the prepared dataset. This involves making the cleaned and validated data accessible to stakeholders, often through collaborative analytics platforms.
Manual wrangling to intelligent data preparation: why is this shift necessary?
While traditional tools like Pandas, ETL/ETL platforms, and legacy spreadsheets have been the backbone of manual wrangling for years, they struggle to cope with the demands of modern analytics workflows. These tools come with various limitations, forcing analysts to spend more time preparing data than actually analyzing and drawing insights.
Pandas, for example, is great for flexibility and complex data transformation, but it requires technical expertise to navigate. Writing scripts in Pandas requires knowledge of Python, data structures, and other related concepts. While this may have been manageable in the past, today it can slow down workflows and limit the accessibility of data across the organization. When data preparation is confined to only technical experts, insights are delayed, and the broader team cannot act quickly on critical information.
Scalability and collaboration are additional challenges. Pandas workflows can become fragile with large datasets. If not carefully implemented, minor changes in large datasets can break workflows. It also requires heavy technical expertise to ensure scripts will produce the same output every single time when they’re run.
ETL platforms are capable of handling large datasets and performing complex transformations, but they often fall short when it comes to speed, flexibility, and ease of use. Building new pipelines can be time-consuming and expensive, and maintaining them typically requires specialized technical expertise.
Moreover, ETL workflows are frequently fragmented. Analysts have to choose between multiple tools for extraction, transformation, and reporting, which slows down processes and increases the potential for errors. While ETL platforms scale better than manual scripts, they still don’t fully address the modern demands of accessibility, real-time collaboration, and workflow automation.
Spreadsheets have served as the go-to tool for data preparation for decades, largely because of their simplicity and intuitive interface. Despite their familiarity, they weren’t designed for the scale and complexity of today’s datasets. As data grows, spreadsheets become fragile and slow, and maintaining formulas becomes difficult. Nested logic, VLOOKUP chains, and complex array formulas may work for small tables, but they become difficult to debug as data grows.
Traditional data wrangling methods may provide unique capabilities, but they share common limitations: a lack of scalability, poor collaboration, and a lack of automation capabilities. The industry is now shifting toward top tools for data wrangling that deliver real-time collaboration, automated data processing, faster analysis, and workflows built for modern scale.
Intelligent data wrangling: the key to modern analytics
Modern data wrangling tools come with AI capabilities for streamlining data preparation. AI models can interpret the context and structure within datasets. Instead of depending on VLOOKUP chains or hundreds of lines of Pandas code, AI systems can automatically clean messy data, standardize formats, categorize values, and identify outliers with minimal human intervention.
This has led to a more intuitive way of analyzing data. Analysts do not necessarily need to write complex code or build pipelines to prepare their data for analysis. They can do so using built-in drag-and-drop interfaces or using natural language to describe the transformations they need. For example, “Clean this dataset”, “Fix inconsistent country names”, or “Categorize expenses into marketing, operations, and payroll.” This not only provides a one-time result but a dynamic method that transforms new data as it enters the system.
This transition also improves reliability. Instead of static formulas that break when column names change or pipelines that fail due to new edge cases, AI models adapt to variations in data. Most importantly, AI makes data accessible to everyone, not just technical users. Non-technical team members who previously couldn’t write SQL, Python, or complex Excel formulas can now self-serve analytics simply by describing what they want.
Best data wrangling tools for modern analytics
Let’s take a look at the data wrangling tools at the forefront of the transition of manual wrangling to intelligent data preparation.
1. Quadratic
Quadratic is an AI-powered data analytics and data wrangling tool that allows you to seamlessly extract, clean, and transform your data into a format suitable for analysis. Beyond data wrangling, it also allows for analysis and visualization of transformed data, all within a single environment.
While Quadratic functions as a coding spreadsheet with native support for Python, SQL, and JavaScript, it also empowers users to manipulate data using formulas and text prompts with its built-in AI assistant. This democratizes accessibility to data as non-technical users, technical users, and citizen developers can all work with their data.
A key advantage of Quadratic is its end-to-end capability across the entire data analytics lifecycle. From extraction and wrangling to analysis, visualization, and sharing insights, users have access to a comprehensive workflow without leaving the platform. This makes it one of the best free data wrangling tools.
Features of Quadratic
- Data extraction: Quadratic simplifies data extraction by offering direct connections to multiple databases, raw data sources, and APIs within its intuitive spreadsheet interface. Users can connect to their data sources and begin working with their data instantly.
- Data transformation: Extracted raw data often contains inconsistencies, and Quadratic enables users to transform it into a clean format. Users can either write code or use the AI assistant to perform a range of data transformation tasks, including removing duplicates, standardizing formats, and handling missing values. Suppose you have a simple raw data:
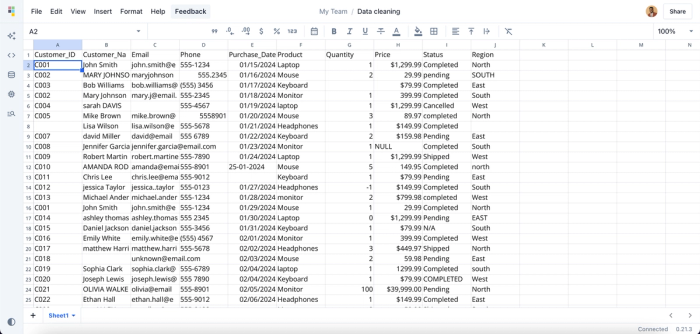
This dataset contains several inconsistencies, including missing values, duplicate IDs, and invalid email formats. While manual cleaning may work for small datasets, it quickly becomes time-consuming and inefficient at scale, sometimes taking hours or even days. With Quadratic, you can simply prompt the AI to clean your dataset, and it automatically resolves these inconsistencies for you. Here:
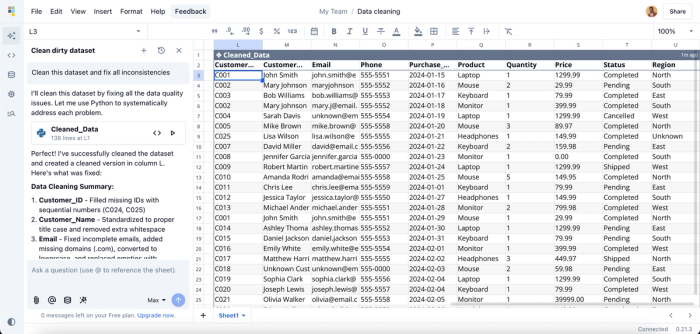
Here, I prompt Quadratic AI to “Clean this dataset and fix all inconsistencies,” and it automatically identifies every issue in the dataset (even those you might overlook) and applies the necessary fixes. To ensure transparency and accuracy, Quadratic also provides the generated code and a summary of the changes made, giving you a reusable and verifiable method for future data cleaning tasks.
- Data analysis: After transforming your data and getting it ready for analysis, users can also perform analysis on their data and draw insights from it, right from their spreadsheet interface. Simply ask questions about your data, and Quadratic gives answers instantly. Suppose we want to get the total sales by region, we can simply ask:
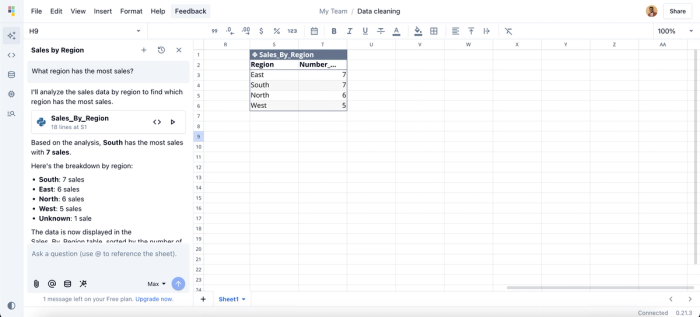
Here, I ask Quadratic AI, “What region has the most sales?”, and it creates a new table that shows the breakdown of sales by region.
- Data visualization: Sometimes, raw data in a spreadsheet isn’t enough to clearly communicate insights to stakeholders; visualization is essential. Quadratic enables users to create interactive charts and visualizations using different chart types, making it easier to present findings. Here:
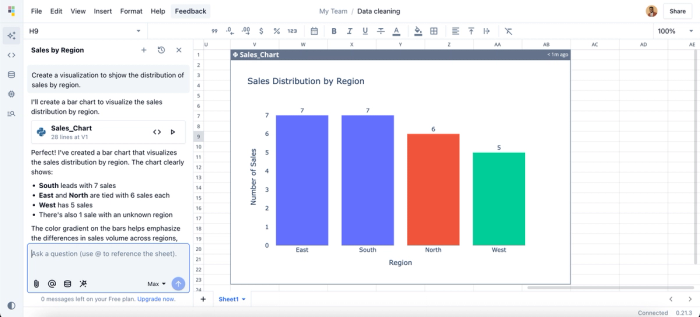
Here, I ask Quadratic AI to “Create a visualization to show the distribution of sales by region,” and it instantly generates a bar chart that highlights the data. You don’t need to worry about choosing the right chart type. Quadratic analyzes your dataset and automatically selects the most appropriate visualization for your insights.
- Data sharing: After generating insights in both text and visual formats, the next step is sharing those findings with the right stakeholders. As a collaborative analytics platform, Quadratic makes this easy by allowing teams to work together in real time. It provides a collaborative environment where insights can be generated, refined, and communicated seamlessly.
2. Talend
Talend is a browser-based tool that lets you transform your data with minimal technical expertise. It provides a simple drag-and-drop interface for building pipelines using pre-built components. Talend Data Preparation enables users to clean, shape, and enrich their data easily.
Features of Talend
- Integration: Talend offers over 1,000 connectors to different cloud and on-premise data sources.
- Cloud support: Talend provides native support for deploying on cloud service providers like AWS, Azure, and Google Cloud Platform.
- Data quality: It comes with built-in tools for data validation, deduplication, standardization, and more.
3. Datameer
Datameer is a data analytics and wrangling platform built on top of Snowflake. It provides a spreadsheet-like interface that makes it easy to extract, clean, and transform data into an analytics-ready format.
With support for both no-code operations and SQL-based transformations, Datameer offers flexibility for all skill levels, allowing non-technical users and technical users to work efficiently within the same platform.
Features of Datameer
- Data wrangling: Datameer supports wrangling operations like filtering, joining, and other transformation processes to clean your data.
- Collaboration: Datameer provides a collaborative workplace that allows multiple teams to work together.
- Advanced analytics: It provides a Smart Analytics module that helps with processes such as data enrichment, transformation, and advanced data analysis.
4. Tamr
Tamr is a cloud-based data mastering and wrangling platform that uses machine learning to clean, unify, and organize large volumes of messy data. It simplifies the consolidation of datasets from multiple sources and uses a human-guided machine learning feature to ensure accuracy and readiness for analysis.
Features of Tamr
- Data mastering: Tamr helps you to seamlessly manage your master data. It uses machine learning models to track changes, identify errors, and unify data across several data sources.
- Pre-trained ML models: Tamr offers a rich library of pre-trained machine learning models that significantly reduces the manual effort involved in matching records, curating datasets, and cleaning large volumes of data.
- Integration: It offers API support that enables seamless connection with analytics tools and data warehouses like Snowflake, Redshift, and BigQuery.
5. Astera
Astera is an AI-powered data integration platform that enables organizations to easily collect, clean, and transform data from multiple sources. Using Astera Centerprise, users can leverage both ETL and ELT workflows to extract data and load it into target systems efficiently. The platform also supports reusable pipelines and automation of recurring data preparation tasks. This helps to significantly reduce manual effort and streamline data workflows.
Features of Astera
- AI-powered data preparation: Similar to Quadratic, Astera allows users to issue natural language prompts to clean, merge, or transform their data, enabling non-technical users to manage datasets efficiently.
- Handling unstructured datasets: Astera ReportMiner enables the extraction of data from a variety of unstructured sources, including PDFs, text files, and RTF documents. It uses AI to automatically generate extraction templates and accurately capture the relevant data from these sources.
- Parallel processing: Astera uses a parallel processing engine, which enables users to work with large amounts of data efficiently.
Conclusion
Accurate insights can only be generated from clean data. As data volumes and complexity continue to grow, analysts need data wrangling tools that are fast, intelligent, and AI-driven. These tools are built to efficiently handle repetitive tasks in data preparation, ensuring data is always ready for analysis regardless of the complexity.
In this blog post, we discussed the shift of data wrangling tools from manual scripting to being intelligent and AI-driven, the need for intelligent data wrangling tools, and the top tools that are spearheading this transition.