This template provides a comprehensive 3 statement financial model designed to forecast a company's financial health over a five-year period (2021–2025E). It integrates the Income Statement, Balance Sheet, and Cash Flow Statement into a cohesive system where data flows logically between accounts to produce a unified financial picture.
Unlike a traditional 3 statement financial model Excel file, this template leverages Quadratic’s ability to combine standard spreadsheet formulas with Python. This allows for more advanced data manipulation and dynamic visualization without relying on fragile external plugins or complex macros.
Template structure & components
Multi-sheet architecture
The model is organized across four interconnected sheets, keeping raw accounting data separate from analytical outputs:
- Income Statement: Tracks operational performance.
- Balance Sheet: Monitors financial position and accounting balance.
- Cash Flow Statement: Reconciles cash movements.
- Financial Analysis: Aggregates data for ratio calculation and visualization.
Data flow
The architecture ensures data integrity by establishing a clear hierarchy. Primary inputs and historical data reside in the three source statement sheets. This data flows into the analytical layer on the Financial Analysis sheet, where Python scripts and formulas derive insights, ensuring that any change to the source data instantly updates all downstream metrics and charts.
The three financial statements
Income statement sheet
This sheet tracks the company's profitability from revenue down to net income over the forecast period. It is built on several key assumptions to project future performance:
- Revenue Growth: Modeled at approximately 15% annually.
- Margins: Maintains a consistent 60% gross margin.
- Operating Expenses: Modeled to scale proportionally with revenue growth.
Balance sheet sheet
The Balance Sheet demonstrates the fundamental accounting equation (Assets = Liabilities + Equity) across all five years. It includes dynamic schedules that link to the other statements:
- Debt Schedule: shows long-term debt declining from $200,000 to $120,000 as repayments occur.
- Equity Logic: Retained earnings are calculated cumulatively, adding net income from the Income Statement and subtracting dividends.
Cash flow statement sheet
This sheet reconciles Net Income to the ending Cash balance, providing a clear view of liquidity. It categorizes cash movements into three distinct activities:
- Operating: Adjusts net income for non-cash items and working capital changes.
- Investing: accounts for Capital Expenditures (CapEx).
- Financing: Tracks debt repayments and dividend distributions.
The ending cash balance calculated here flows back to the Balance Sheet, ensuring the model remains balanced.
Financial analysis & ratios
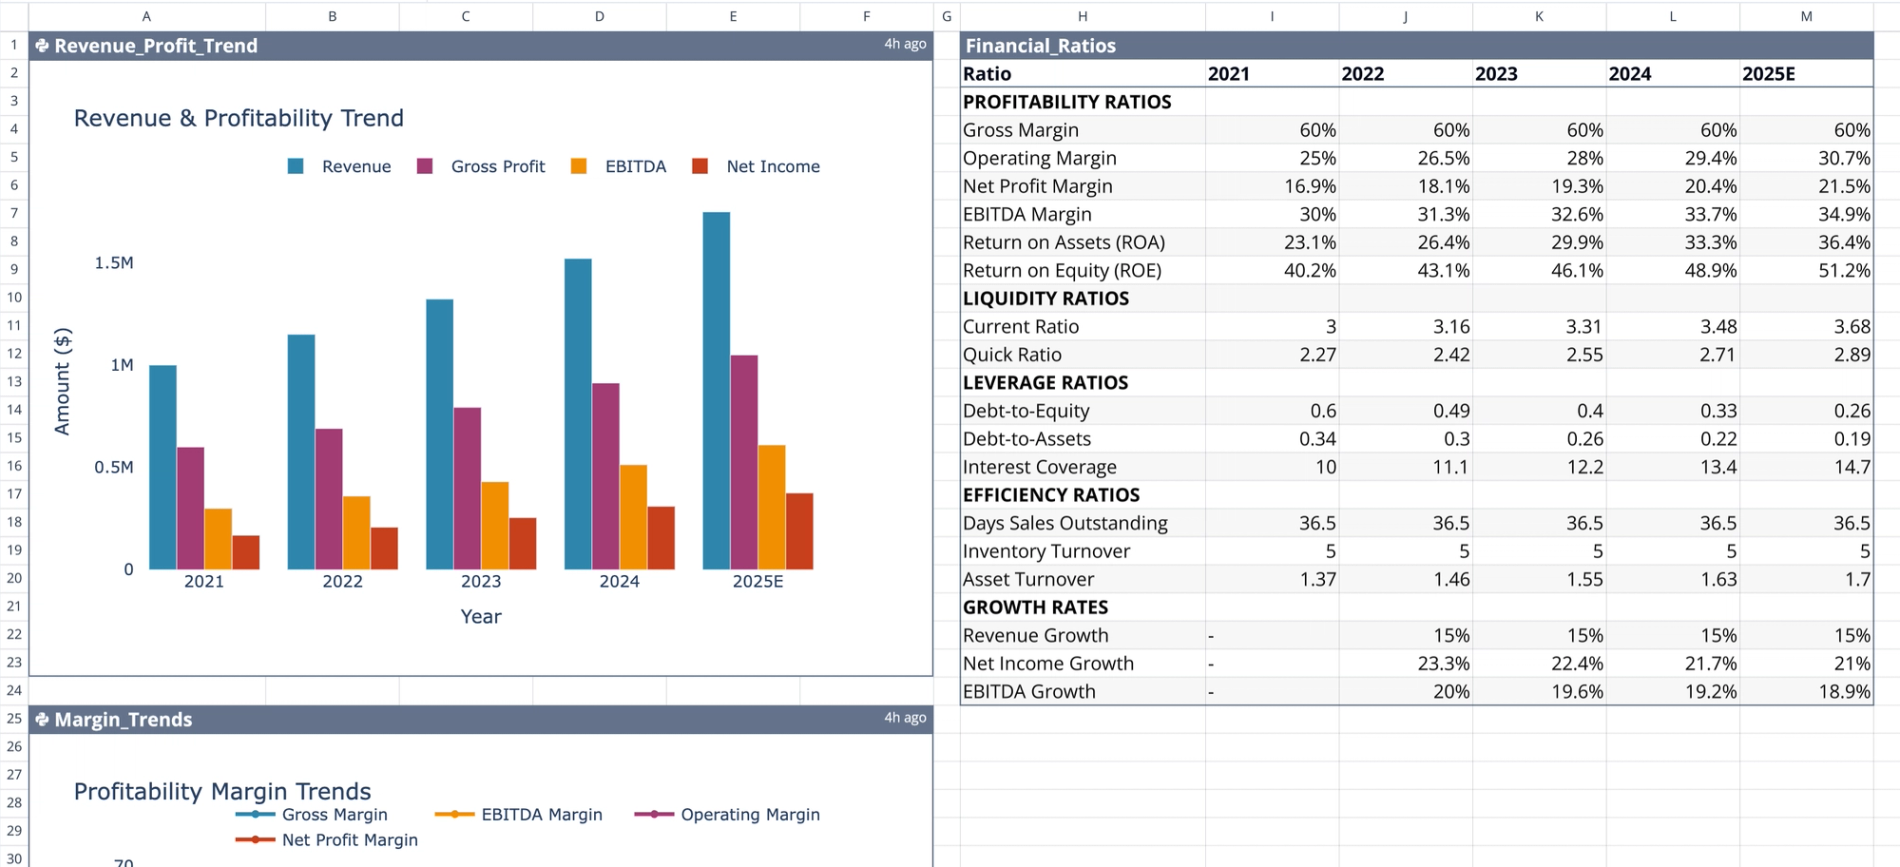
The Financial_Ratios table
Located on the Financial Analysis sheet, this table serves as a primary 3 statement financial model example of how to centralize metrics. It pulls data directly from the three source sheets to calculate performance indicators without altering the underlying accounting data.
Key metrics calculated
The table computes a wide range of ratios to assess company health:
- Profitability: Includes Gross margin, Operating margin, Net Profit margin, and EBITDA margin. Return on Equity (ROE) is shown improving from 40.2% to 51.2% as net income outpaces equity growth.
- Liquidity & Leverage: Tracks financial risk, including Interest Coverage and Debt-to-Equity. The Debt-to-Assets ratio declines from 0.34 to 0.19, reflecting the aggressive debt paydown schedule.
- Efficiency: Measures operational effectiveness through Days Sales Outstanding (DSO), Inventory Turnover, and Asset Turnover.
- Growth: Calculates year-over-year growth rates for Revenue and EBITDA.
Python visualizations using Plotly
Integration
Quadratic allows Python cells to reference data directly from the structured financial tables. This template uses Python libraries like Plotly to generate interactive charts that update automatically as the model data changes.
Revenue_Profit_Trend
This visualization plots the correlation between top-line revenue growth and bottom-line profitability using financial time series analysis over the five-year forecast. It helps analysts visually confirm that profit growth is tracking with revenue expansion.
Margin_Trends
This chart tracks the evolution of key margin percentages (Gross, Operating, Net) over time. It provides a quick visual check on operational efficiency and cost control stability across the forecast period.
How to use this template
Modifying assumptions
To adjust the forecast, navigate to the Income Statement sheet. Changing values for revenue growth rates, cost of goods sold (COGS), or operating expenses will instantly cascade through the Balance Sheet, Cash Flow Statement, and Financial Analysis tabs.
Customizing ratios
Users can expand the 3 financial statement model capabilities by adding new columns to the Financial_Ratios table. You can use standard spreadsheet formulas to reference data from the source sheets to calculate industry-specific metrics not already included.
Expanding the model
To extend the timeline beyond 2025E, add new columns to the data tables in all three statement sheets. Ensure that the formulas for the previous years are dragged forward to maintain the logic for calculating retained earnings, cumulative debt, and cash balances.
Use Quadratic to build and analyze a 3 statement financial model
- Combine spreadsheet formulas with Python for advanced data manipulation and dynamic visualization.
- Ensure data integrity with a multi-sheet architecture where changes instantly update all metrics and charts.
- Calculate a wide range of financial ratios directly from source statements without altering underlying data.
- Generate interactive Python visualizations that automatically update with model changes.
- Easily modify key assumptions and extend forecast timelines across all interconnected statements.
Related templates
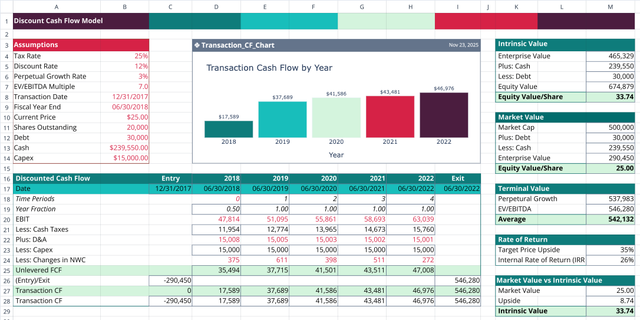
Discounted Cash Flow Model Template
Project cash flows, apply discount rates, and compare intrinsic value to market price.
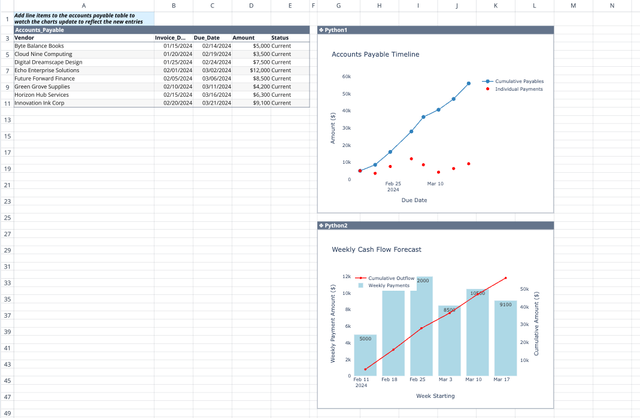
Accounts Payable Template
Get real-time visibility and insights into your payment obligations.
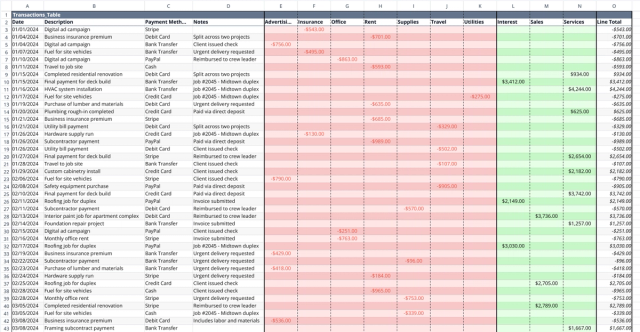
Small Business Bookkeeping Template
Track income and expenses, visualize cash flow trends, and gain financial insights.