Table of contents
- What is P&L analysis? (and why it breaks in spreadsheets)
- Step 1: Integrating multi-sheet financial data
- Step 2: Calculating metrics & variance analysis
- Step 3: Dynamic scenario planning (realistic vs. pessimistic)
- Step 4: Visualizing cash flow & break-even points
- The future: AI tools for P&L analysis
- Conclusion: Moving beyond the grid
Financial modeling often feels like a high-stakes game of Jenga. You build a complex structure of revenue projections, operational costs, and capital expenditures, but one wrong move—a broken cell reference or a shifted column—can bring the whole model crashing down. For financial analysts and project managers, this fragility is the enemy of insight.
At its core, P&L analysis (Profit and Loss) is the backbone of determining project viability, including detailed product profitability analysis. It tells you if a venture will make money, how much, and when. However, effective analysis is not just about recording history; it is about forecasting the future with confidence. To do that, modern finance professionals are moving away from static, fragile spreadsheets toward dynamic, code-enabled modeling that ensures accuracy and simplifies scenario planning, embracing techniques of financial data analytics.
What is P&L analysis? (and why it breaks in spreadsheets)
For those new to the concept, a P&L analysis summarizes the revenues, costs, and expenses incurred during a specific period, often referred to as an P&L statement. The standard components are familiar to anyone in accounting:
- Revenue: The total income generated from sales.
- COGS (Cost of Goods Sold): Direct costs attributable to the production of the goods sold.
- Gross Margin: Revenue minus COGS.
- OPEX (Operating Expenses): Rent, payroll, marketing, and other overheads.
- Net Profit: The bottom line—what remains after all expenses are subtracted.
While the math is straightforward, the execution in traditional spreadsheets is often where how to do a P&L analysis becomes a headache. The "Excel Hell" problem arises when you try to scale this analysis, with reports indicating that close to 90% of spreadsheets contain errors. You might have equipment specs on one tab, a hiring plan on another, and revenue forecasts on a third. Linking these via standard formulas creates fragile dependencies. If you insert a row in the "Payroll" sheet, your "Master P&L" might suddenly point to the wrong cell, leading to "fat-finger" errors that are difficult to trace.
The modern approach, utilized by tools like Quadratic, shifts this workflow from manual cell-linking to structured data modeling, drawing on principles of effective database design for financial applications using SQL and Python. This allows you to build a P&L analysis example that is resilient, audit-proof, and automated.
Step 1: Integrating multi-sheet financial data
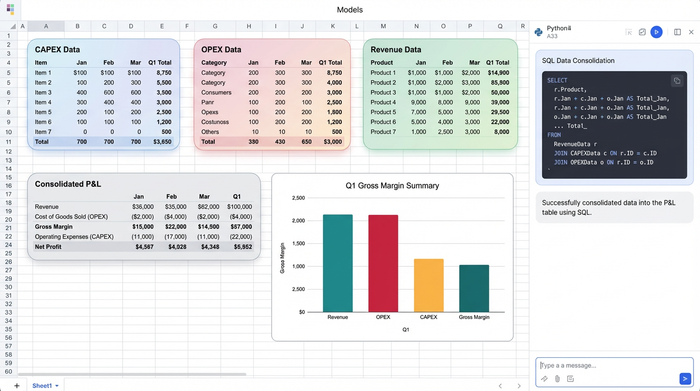
Consider a real-world scenario where a user is modeling a multi-year project. They have detailed data spread across several sheets: a Capital Expenditures (CAPEX) sheet listing equipment and depreciation, an Operational Expenses (OPEX) sheet for rent and utilities, and a Revenue sheet tracking sales and commissions.
In a traditional workflow, bringing this data into a central P&L view involves a web of VLOOKUPs or INDEX-MATCH formulas. If a column moves in the source data, the P&L breaks.
In Quadratic, you can bypass this fragility by using SQL directly within the spreadsheet. Instead of pointing to "Sheet2!C5:C50," you can write a simple query like SELECT sum(cost) FROM capex_sheet WHERE type = 'equipment'. This pulls the exact data you need, regardless of where it sits on the sheet. If the equipment list changes or expands, the SQL query automatically captures the new total. This ensures that your P&L analysis is always synchronized with your source data, eliminating the risk of manual copy-paste errors.
Step 2: Calculating metrics & variance analysis
Once the data is centralized, the next step is calculating key performance metrics such as Net Profit, Break-even points, and Payback periods. This is also where P&L variance analysis comes into play—comparing your actual performance against your forecasts, utilizing various financial forecasting methods, to understand where you are over or under budget.
Standard spreadsheets obscure the logic behind these calculations. A formula like =C4 - D4 requires you to constantly check what is in column C and column D. If you are sharing this model with investors or stakeholders, they have to audit every cell to trust the numbers.
Quadratic changes this dynamic by allowing you to use Python variables. You can define your inputs clearly in code, making the math readable in plain English: net_profit = total_revenue - total_expenses. This transparency is crucial for P&L reconciliation & analysis. When an auditor or a VP of Finance looks at your model, they don't see a grid of cryptic cell references; they see clear logic that explains exactly how profitability is derived.
Step 3: Dynamic scenario planning (realistic vs. pessimistic)
Perhaps the most valuable aspect of a robust P&L model is the ability to answer "What if?" questions, often explored through advanced techniques like Monte Carlo simulation and dynamic scenario planning. In a standard spreadsheet environment, creating a "Pessimistic Case" usually means duplicating the entire workbook, renaming it "Project_Model_v2_Pessimistic.xlsx," and manually adjusting growth rates. This leads to version control nightmares.
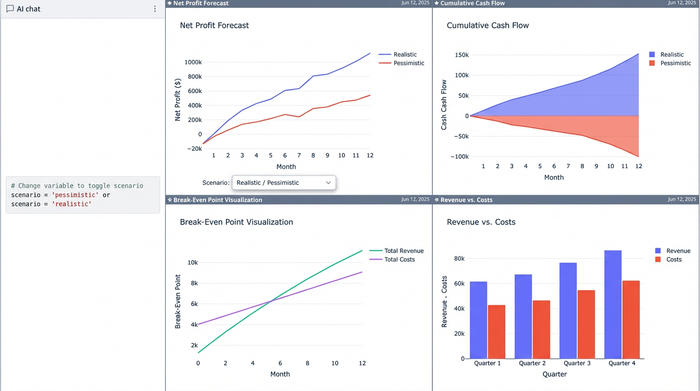
In a code-enabled spreadsheet, you can handle scenario planning with a single variable. You can set up a variable called scenario that acts as a switch.
- If
scenario == 'realistic', the model uses a standard growth rate. - If
scenario == 'pessimistic', the model automatically applies higher inflation rates and lower sales volumes.
By changing that one variable, the entire P&L—across all months and years—recalculates instantly. This allows you to toggle between best-case and worst-case scenarios in real-time during a meeting, without ever leaving the main view or managing multiple files.
Step 4: Visualizing cash flow & break-even points
Rows of numbers are necessary for the analyst, but they are rarely effective for the decision-maker. To communicate the findings of a P&L analysis example, you need to visualize the data, specifically the "crossover point" where the project breaks even and becomes profitable.
While standard charts are useful, they can be limited in customization. Quadratic allows you to use Python libraries like Matplotlib or Plotly directly in the grid to create a dashboard in Python, enabling sophisticated, interactive visualizations that plot cumulative cash flow against time, clearly marking the exact month where the investment pays back. Because these charts are generated by code, they update automatically as you toggle your scenarios. If you switch to the "pessimistic" view, the chart instantly reflects the delayed break-even point, giving stakeholders an immediate visual understanding of the risk.
The future: AI tools for P&L analysis
As financial modeling evolves, AI P&L analysis is becoming a critical component of the workflow. The integration of AI into data tools allows analysts to move faster and dig deeper.
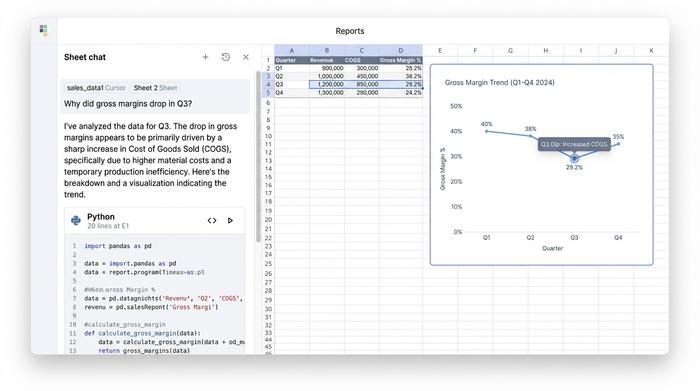
AI tools for P&L analysis can assist in several ways. For instance, in Quadratic, you can use AI to write the Python code for complex forecasting models, lowering the barrier to entry for advanced analytics. Beyond code generation, AI can help with P&L reconciliation by analyzing trends and flagging anomalies, a key application of AI in financial anomaly detection—such as asking the AI to explain why gross margins dropped in Q3 based on the underlying data. This moves the analyst's role from data entry to strategic interpretation, leveraging AI to handle the heavy lifting of data extraction and pattern recognition.
Conclusion: Moving beyond the grid
A P&L is more than just a report; it is a strategic tool for decision-making. When you rely on fragile cell references and manual updates, you spend your time fixing broken formulas rather than analyzing the business.
By moving your financial modeling into a robust environment like Quadratic, which is one of the best data science tools available, you gain the power of Python and SQL alongside the familiarity of the spreadsheet. You can integrate multi-sheet data without fear, perform transparent variance analysis, and toggle scenarios instantly. It allows you to trust your numbers and focus on the story they tell.
If you are ready to build a financial model that is as dynamic as your business, try building your next P&L in Quadratic.
Use Quadratic to do P&L analysis
- Build resilient P&L models: Integrate data from multiple sheets (CAPEX, OPEX, Revenue) using SQL queries, eliminating fragile VLOOKUPs and ensuring your analysis stays connected and accurate even as source data changes.
- Ensure transparent calculations: Define key metrics like net profit and break-even points with clear Python variables, making your P&L reconciliation and analysis logic easy to understand and audit, not cryptic cell references.
- Perform dynamic scenario planning: Instantly toggle between "realistic" and "pessimistic" P&L scenarios by changing a single Python variable, recalculating your entire model on the fly without creating multiple workbooks.
- Visualize profitability and cash flow: Generate sophisticated, interactive charts with Python libraries directly in the grid, clearly showing break-even points and cumulative cash flow that dynamically update with your scenario changes.
- Leverage AI for deeper insights: Use AI to write Python code for complex forecasts, identify anomalies, and explain P&L variances, freeing you to focus on strategic interpretation rather than manual data work.
Ready to build more robust and insightful financial models? Try Quadratic.