The stock history calculator is designed for stock market analysis, visualizing historical asset price data dynamically based on user-defined parameters. By leveraging Quadratic's native Python integration, the template automatically fetches and charts financial data without requiring manual data entry. It pulls real-time financial data (OHLCV metrics: Open, High, Low, Close, Volume) directly into the spreadsheet, providing an immediate, reactive view of market performance.
Core components of the stock price history calculator
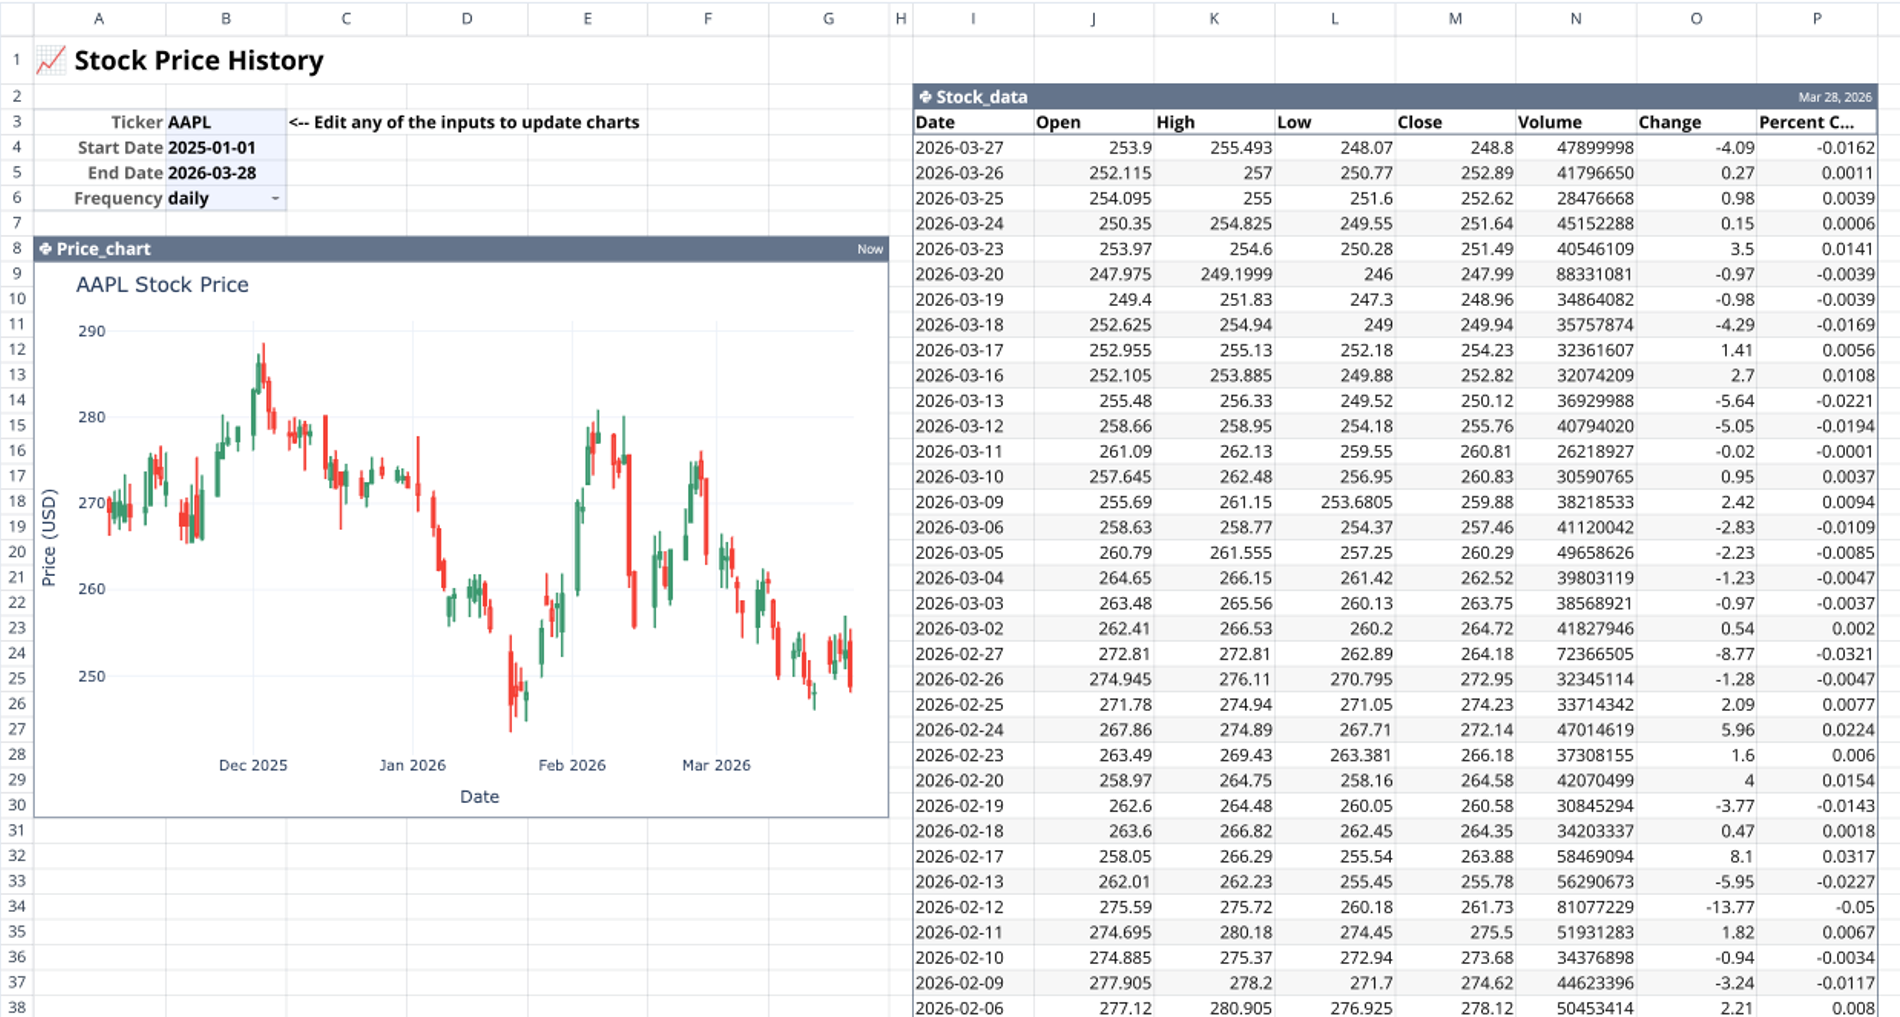
This template consists of a single sheet titled "Stock Price History" organized into three functional layers.
User input area
Located in cells A1 through B6, this section acts as the central control layer for the template. It contains four editable parameters: a stock ticker symbol (defaulting to "AAPL"), a start date, an end date, and a frequency setting (defaulting to "daily"). All downstream Python computations depend entirely on these values.
Python data-fetching table
Anchored at cell I2 and spanning to P103, the Python code table named Stock_data handles data retrieval. It uses q.cells() to read the ticker, dates, and frequency reactively from the input area. The code calls q.financial.stock_prices() to generate a live, scrollable 100-row DataFrame of historical OHLCV data. This table also includes derived columns for price change and percent change.
Dynamic Python chart
Located in cells A8 through G30, the Price_chart cell generates the visual output. It reads the populated Stock_data table and the ticker symbol back into Python using q.cells(). It then sorts the data ascending by date and renders an interactive Plotly candlestick chart, plotting the date on the x-axis and the price in USD on the y-axis. Because it references reactive data, the chart updates automatically whenever the input cells change. The range slider is disabled for a cleaner layout within its bounded spreadsheet region.
How to use the stock value history calculator
Configure the input parameters
Start by modifying the values in the user input area to match your analysis needs.
- Enter a specific ticker symbol (e.g., AAPL, TSLA, or WMT) to function as an Apple stock history calculator, Tesla stock history calculator, or Walmart stock history calculator.
- Set the desired start and end dates for the analysis window.
- Choose a data frequency, such as "daily".
View historical data and charts
Because Quadratic's cell references are reactive, any change to the inputs automatically triggers a re-execution of the Python cells.
- Watch the Stock_data table automatically refresh the historical OHLCV data upon input modification.
- Interact with the Plotly candlestick chart to analyze price movements over the specified timeline.
- Review derived metrics in the data table to assess daily volatility or use the data as a baseline stock split history calculator.
Who this stock history calculator is for
This template is designed for professionals and individuals looking to automate financial data analysis inside a spreadsheet environment. It is particularly useful for:
- Financial analysts performing asset research, tracking historical asset performance and price trends.
- Retail investors comparing historical metrics for specific companies.
- Data scientists building automated, reactive financial reporting workflows.
- Quadratic users learning to integrate Python financial libraries and Plotly charts with spreadsheet inputs.
Use Quadratic to calculate stock history and visualize dynamic price charts
- Automatically fetch OHLCV (Open, High, Low, Close, Volume) stock data without manual entry.
- Dynamically update historical data tables and interactive Plotly candlestick charts by adjusting input cells.
- Customize analysis for any stock ticker, start/end dates, and data frequency directly in the spreadsheet.
- Generate derived metrics like price change and percent change for immediate market performance views.
- Integrate Python's financial data fetching and charting capabilities seamlessly with spreadsheet controls.
Related templates
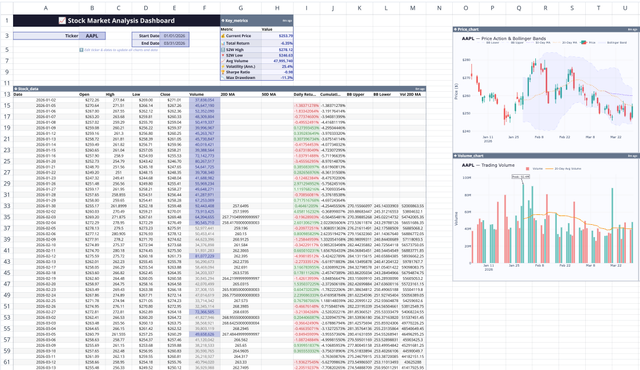
Stock Market Analysis Template
Study the markets with an interactive spreadsheet tracking any publicly traded company.
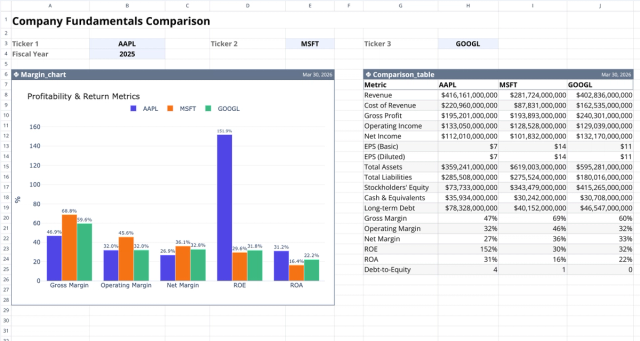
Fundamental Analysis Template: Compare Stocks
Compare fundamental financial metrics and profitability across companies.
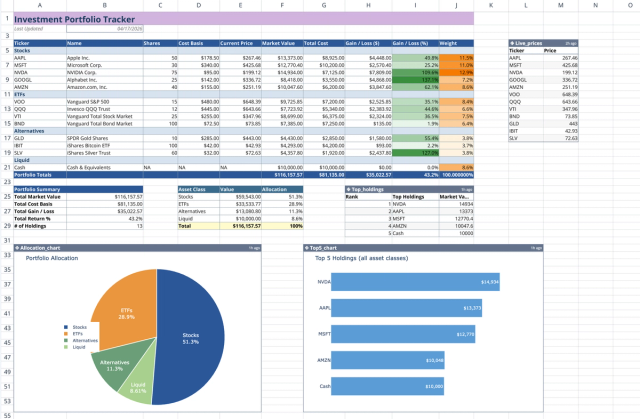
Investment Portfolio Template: Real-time Performance & Charts
Visualize and track your investment portfolio with live data.