This product user metrics dashboard template empowers businesses to visualize and analyze critical user behavior data in one comprehensive view. Built for modern SaaS companies and product teams, this usage dashboard transforms raw user data into actionable insights through interactive charts, heatmaps, and geographic visualizations.
What this template offers
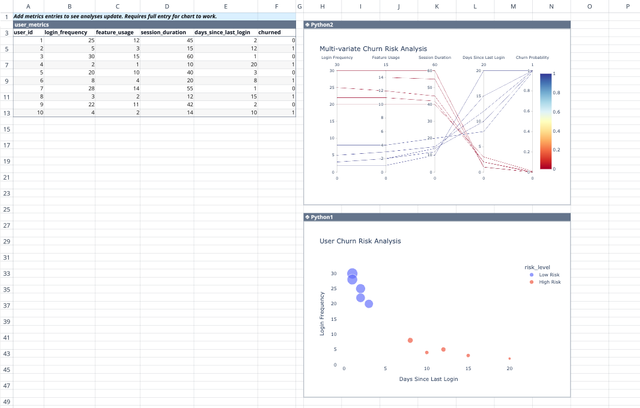
Our SaaS analytics dashboard combines user demographics, engagement patterns, and behavioral metrics to provide a complete picture of your product's performance. The template includes pre-built visualizations for daily active users, feature adoption funnels, customer churn prediction analysis, and geographic user distribution—everything needed for effective product analytics.
How to use this product metrics template
Getting started
Simply import your user data into the provided data tables, or connect directly to the Mixpanel API. The template accepts standard user attributes like signup dates, session data, feature usage, and spending information.
Interactive analysis
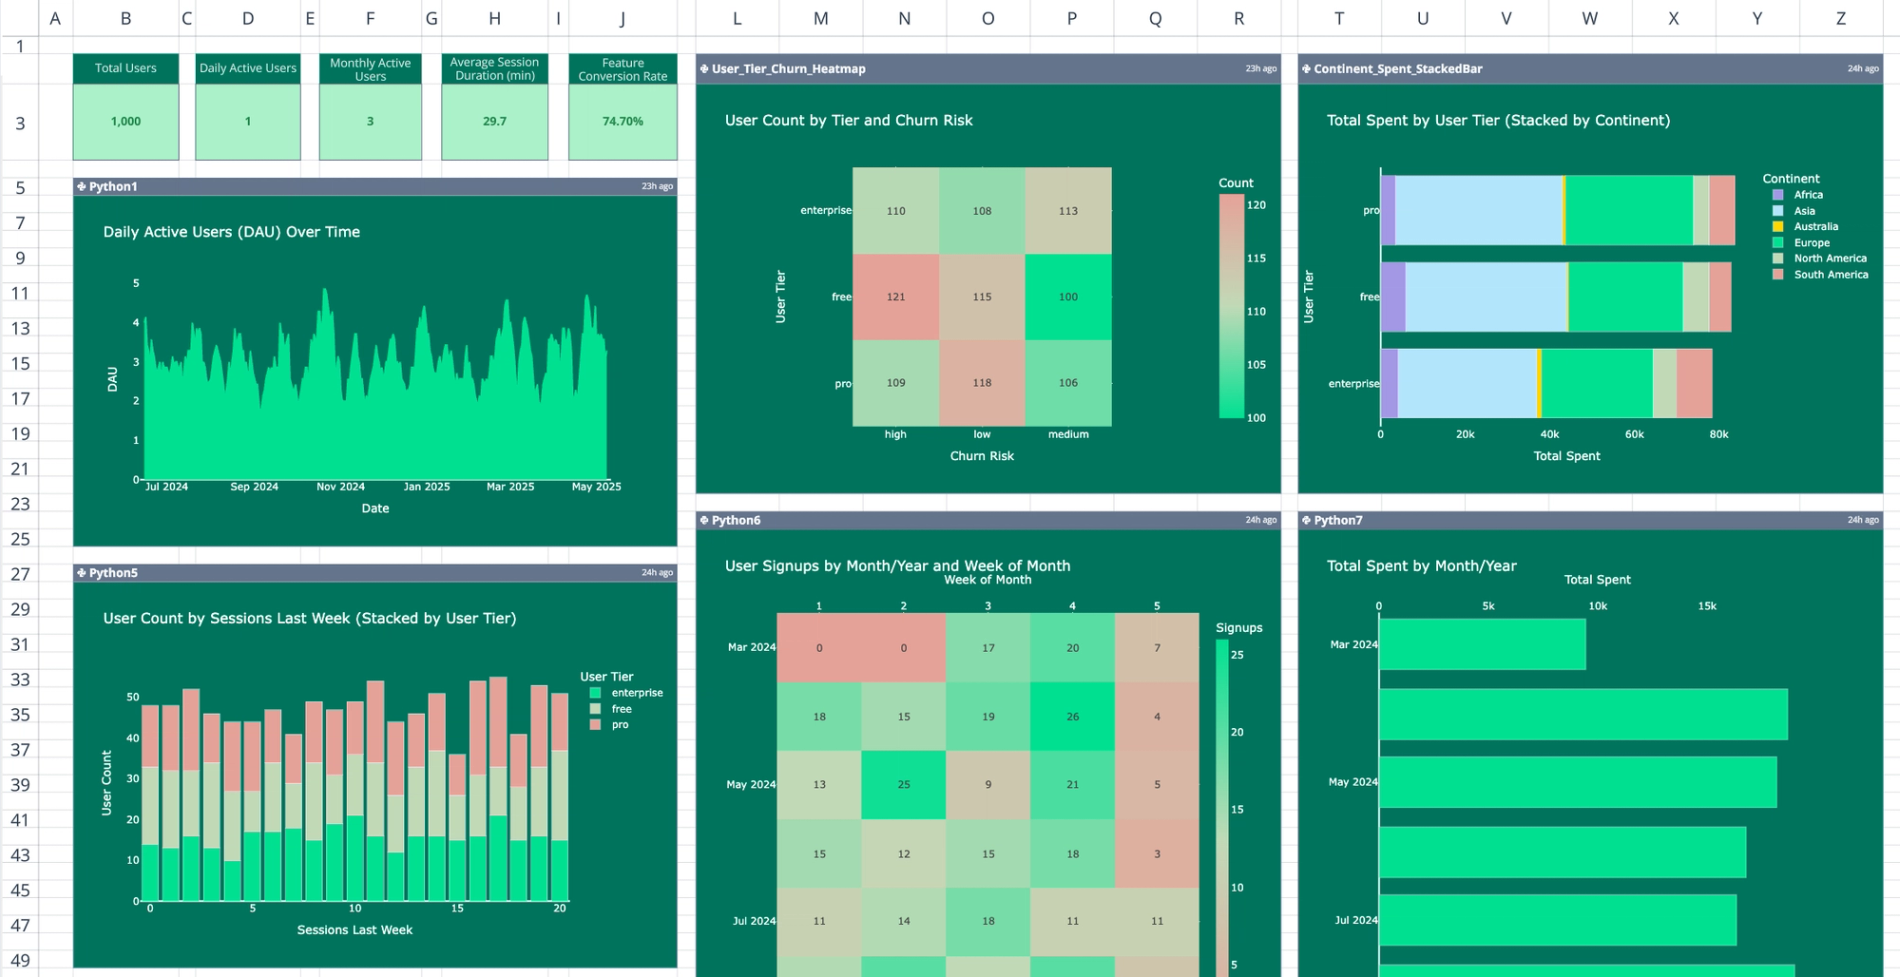
The dashboard automatically generates eight dynamic visualizations:
- Daily active user trends with smoothed averages
- User tier distribution and churn risk heatmaps
- Feature adoption funnels showing conversion rates
- Geographic analysis of user adoption patterns
- Session frequency breakdowns by user segments
Best practices
Update your data regularly to maintain current insights. Use the continent mapping feature to analyze global user patterns, and leverage the time-based visualizations to identify seasonal trends or growth patterns.
Perfect for product teams and SaaS companies
This product usage dashboard serves product managers, data analysts, marketing teams, and executives who need to understand user behavior. Whether you're a startup tracking early adoption or an established SaaS company optimizing retention, this template scales with your needs.
Real-world applications:
- Monitor feature rollout success rates
- Identify at-risk user segments for proactive retention
- Analyze geographic expansion opportunities
- Track user engagement across different subscription tiers
- Measure the impact of product changes on user behavior
Advanced analytics made simple
Unlike static reporting tools, this product metrics dashboard template leverages Quadratic's Python integration for sophisticated analysis while maintaining spreadsheet familiarity. The template includes correlation analysis, time-series smoothing, and automated data processing—no coding experience required.
The visual design uses a cohesive color scheme optimized for professional presentations, making it easy to share insights with stakeholders or include in executive reports.
Start analyzing your product metrics today
Ready to transform your user data into strategic insights? This template provides everything needed to build a comprehensive analytics foundation for your product. Download the product user metrics dashboard template and start uncovering the patterns that drive your business growth.