Managing inventory effectively requires knowing exactly how much buffer stock to maintain. This safety stock calculator template eliminates guesswork by providing a data-driven approach to calculating safety stock levels that protect your business from stockouts while minimizing excess inventory costs.
What this template does
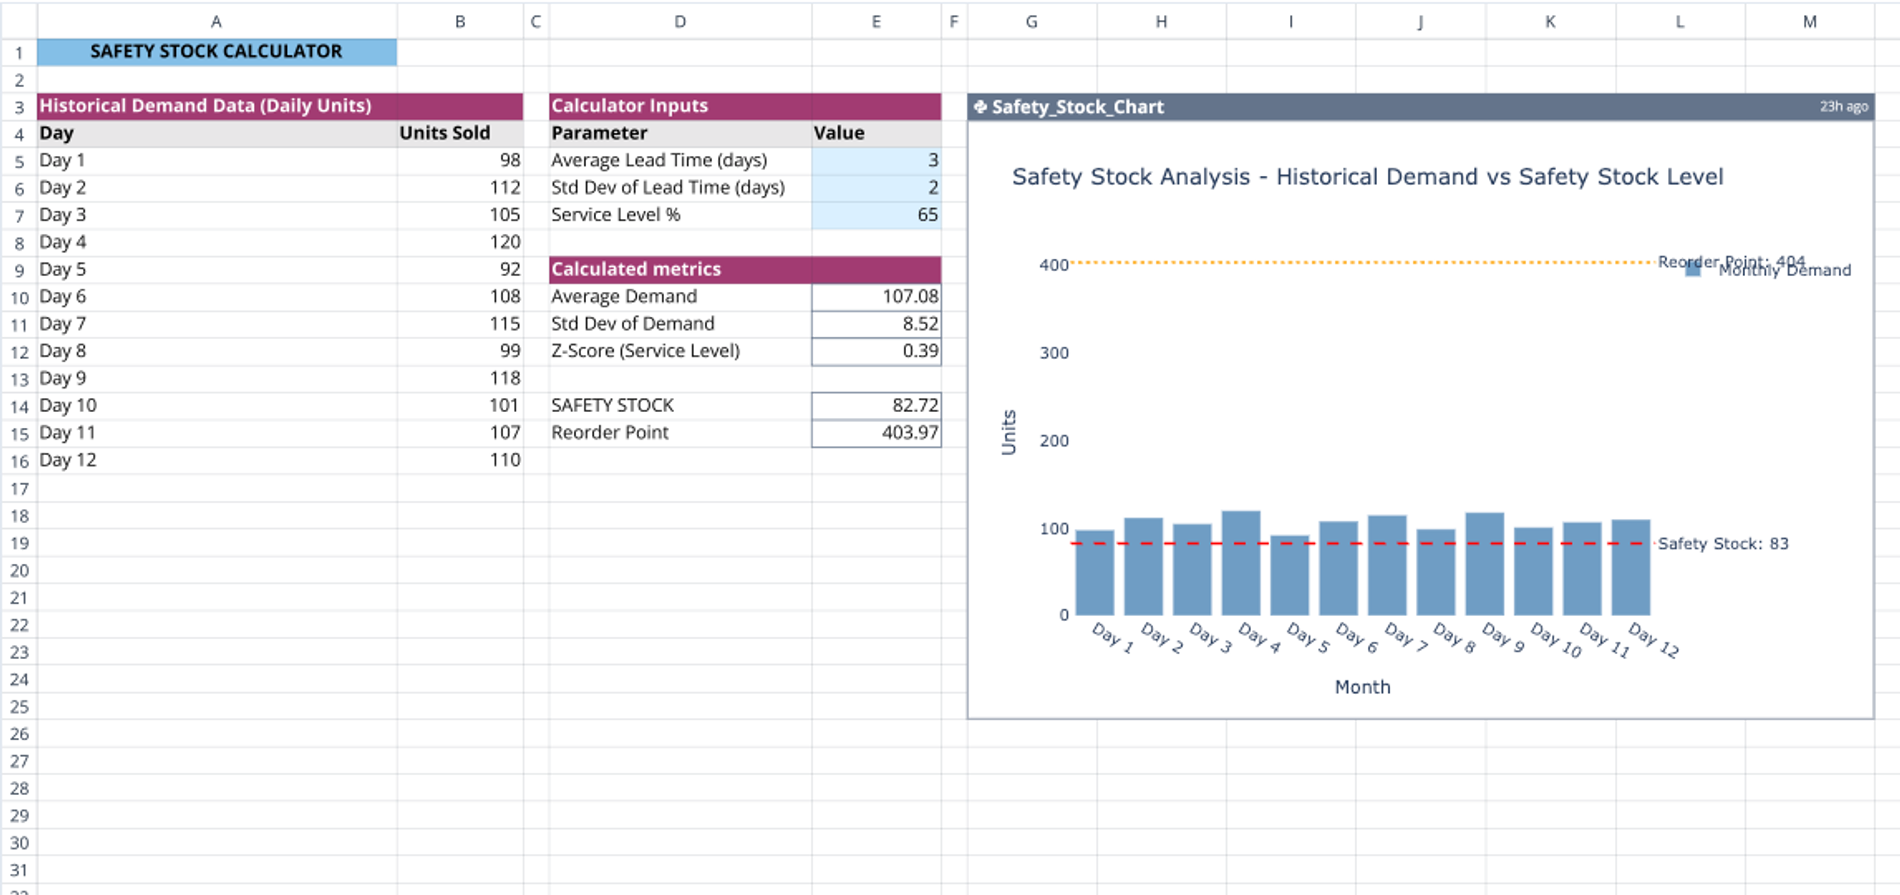
This template helps you determine optimal safety stock levels using statistical methods based on your historical demand data, lead time variability, and desired service levels. Simply input your daily sales figures and a few key parameters, and the calculator instantly computes your recommended safety stock and reorder point. Whether you're running an e-commerce business, managing warehouse operations, or overseeing retail inventory, this tool provides the analytical foundation for smarter inventory decisions.
How to use this template
Step 1: Enter your historical demand data in the "Units Sold" column. The template accommodates 12 days of data by default, but you can expand it as needed to capture seasonal patterns or longer cycles.
Step 2: Input your operational parameters in the Calculator Inputs section:
- Average lead time from your suppliers (in days)
- Standard deviation of lead time to account for delivery variability
- Your target service level percentage (typically 90-99% for critical items)
Step 3: The template automatically calculates key metrics including average demand, demand variability, and the statistical z-score corresponding to your service level. These feed into the safety stock calculation formula.
Step 4: Review your results—the template displays your recommended safety stock quantity and reorder point in clearly labeled cells. A visual chart illustrates demand patterns to help you identify trends.
Best Practice Tip: Update your historical data regularly to ensure calculations reflect current market conditions. Higher service levels provide better stockout protection but increase carrying costs.
Who benefits from this template
This safety stock calculation Excel template serves inventory managers, supply chain professionals, operations analysts, small business owners, and anyone responsible for maintaining optimal stock levels. Retail businesses can prevent lost sales during peak seasons, manufacturers can ensure continuous production, and distributors can balance customer satisfaction with warehousing costs.
Real-world applications include calculating safety stock for fast-moving consumer goods, managing spare parts inventory for equipment maintenance, planning seasonal inventory for fashion retailers, and optimizing stock levels across multiple warehouse locations.
What makes this template unique
Unlike basic spreadsheets, this template leverages Quadratic's Python integration to provide dynamic calculations and visualizations. The built-in chart updates automatically as you modify inputs, giving you immediate visual feedback on demand patterns. The statistical approach ensures your calculate safety stock decisions are grounded in proven inventory management principles.
Ready to optimize your inventory?
Duplicate this template today and take control of your inventory management with confidence. No complex formulas to write—just input your data and let the calculator do the work. Start making data-informed decisions that reduce stockouts, lower carrying costs, and improve customer satisfaction.
Related templates
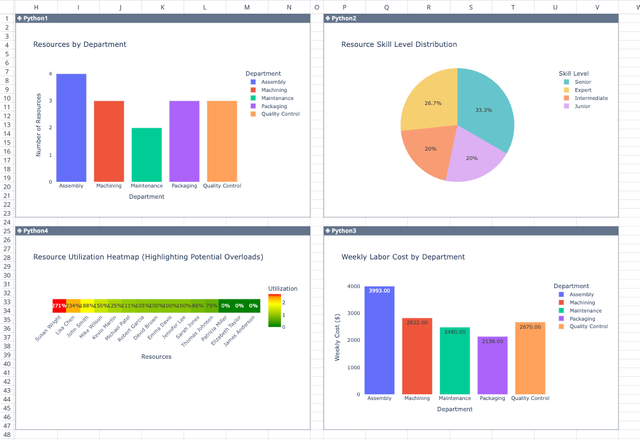
Resource Capacity Planning Template
Optimize workforce allocation and track utilization effectively.
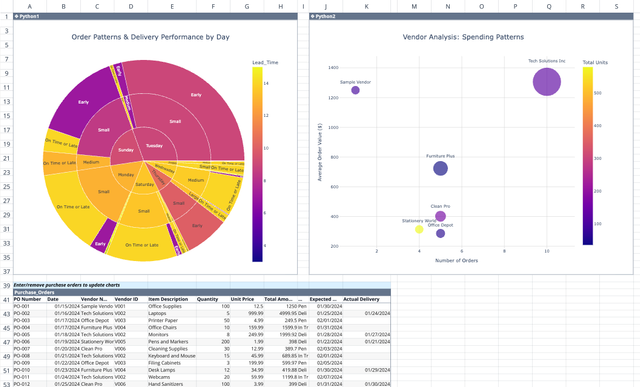
Purchase Order (PO) Tracker
Visualize and analyze your purchasing patterns for optimal PO tracking.
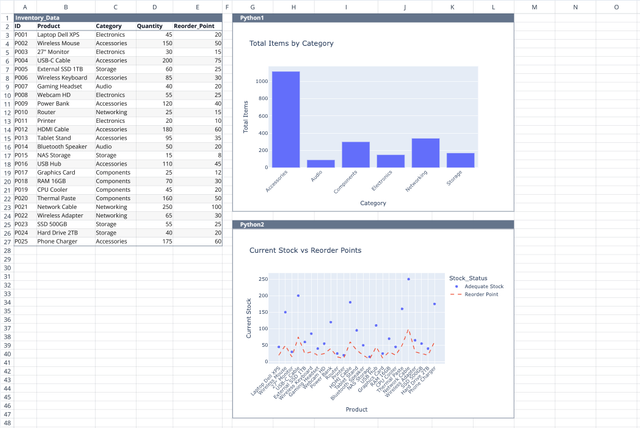
Inventory Tracking Template
Track product quantities, categories, and reorder points with interactive charts.