
Table of contents
- The challenges of manual heavy metal analysis in food
- Step 1: Automating data ingestion & cleaning
- Step 2: Calibration curves & statistical rigor
- Step 3: Handling uncertainty analysis & propagation
- Step 4: Automating compliance checks (pass/fail logic)
- Why this approach improves data integrity
- Conclusion: Professional reporting without the headache
- Use Quadratic to Streamline Heavy Metal Food Analysis
When a laboratory analyst signs off on a report regarding heavy metal food analysis, they are not just checking a box. They are certifying that a product is safe for consumption, adhering to strict regulatory limits for contaminants like lead, cadmium, mercury, and arsenic. The stakes are incredibly high, yet the tools available to most analysts often feel dangerously fragile. There is a better way to handle modern analytical data management, leveraging the power of AI spreadsheet analysis. By integrating Python directly into the spreadsheet grid, Quadratic offers a solution that combines the data integrity required for compliance with the usability analysts need, making it accessible even for those who want to learn Python with zero knowledge.
The challenges of manual heavy metal analysis in food
For the laboratory analyst, the workflow for heavy metal analysis in food is fraught with potential pitfalls. Unlike simple weighing operations, this type of chemical analysis involves complex data transformations, rigorous statistical checks, and strict adherence to standards such as ISO 17025 or FDA regulations.
The reality for many labs is "spreadsheet hell." To get from a raw instrument file to a final certificate of analysis, an analyst often has to maintain a master workbook with dozens of tabs. They face specific, recurring pain points:
- Fragile uncertainty budgets: Calculating the combined standard uncertainty requires referencing purity, mass, and volume data across different sheets. If one cell reference breaks, the error propagates silently.
- Transcription errors: Manually copying data from an ICP-MS or AA spectrometer CSV output into an Excel calculation sheet introduces the risk of "fat-finger" errors.
- Lack of auditability: Standard
.xlsxfiles do not easily show how data moved from point A to point B, making it difficult to prove data integrity during an audit.
Step 1: Automating data ingestion & cleaning
The first step in modernizing this workflow is eliminating the manual copy-paste process. In Quadratic, laboratory data automation is handled through Python, providing robust data cleaning tools. Instead of manual entry, the analyst can use a Python cell to pull data directly from the raw CSV file or a connected database. Using the Pandas library, the raw instrument data is ingested, cleaned, and populated into the grid automatically.
This approach ensures that the data in the spreadsheet is an exact match to the data produced by the instrument. The "chain of custody" for that data is preserved in the code, which remains visible and auditable. If the raw file updates, the spreadsheet updates instantly, removing the need for repetitive manual work.
Step 2: Calibration curves & statistical rigor
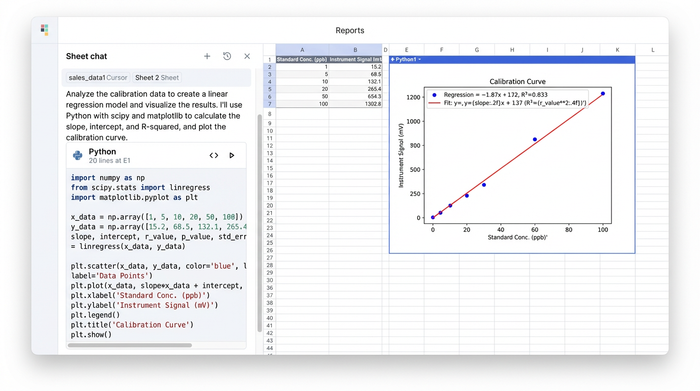
Once the raw signal data is in the sheet, the next challenge is converting it into concentration values. This requires robust calibration curve management. In standard spreadsheets, analysts often rely on complex array formulas or separate software to calculate the slope, intercept, and correlation coefficient (R squared).
Quadratic allows analysts to perform these calculations with greater statistical rigor using Python libraries like SciPy or NumPy directly in the grid. Rather than hiding the math behind a cell reference, the regression logic is written in clear, executable code.
This method is particularly useful for calculating Limits of Detection (LOD) and Limits of Quantitation (LOQ). The analyst can script the calculation to automatically flag any sample that falls below the LOQ, ensuring that low-level contaminants are reported correctly according to method requirements. The calibration curve can also be visualized dynamically using Python graphing libraries, providing an immediate visual check on the linearity of the standard points.
Step 3: Handling uncertainty analysis & propagation
Perhaps the most complex aspect of this workflow is the uncertainty analysis. To comply with ISO 17025, labs must report the expanded uncertainty associated with their measurements. This involves the "GUM" method (Guide to the Expression of Uncertainty in Measurement), which requires combining uncertainties from mass balances, pipettes, standard purity, and the instrument itself.
In a traditional spreadsheet, this becomes a web of interlinked cells that is difficult to update and easy to break. In Quadratic, the analyst can centralize these uncertainty budgets. By defining variables for purity, mass, and volume in Python, the error propagation can be calculated programmatically.
If a certificate of analysis for a reference standard changes, the analyst simply updates the purity variable in one place. The Python code automatically propagates this change through the entire calculation, updating the final expanded uncertainty for every sample in the batch. This turns a headache-inducing task into a reliable, automated process.
Step 4: Automating compliance checks (pass/fail logic)
The final stage of the analysis is determining whether a sample passes or fails based on regulatory thresholds. For example, if the limit for lead in a specific food matrix is 0.1 mg/kg, the report must clearly indicate if a sample exceeds this value.
Using Python's conditional logic, this reporting becomes dynamic. The analyst can write a simple script that compares the calculated concentration (including the uncertainty range) against the regulatory limit.
- If the result is below the limit, the cell returns "PASS."
- If the result is above the limit, the cell returns "FAIL" and flags the specific contaminant.
This logic can be paired with visual cues, such as changing the cell color, to immediately alert the Quality Control Manager to non-compliant samples. This reduces the cognitive load on the reviewer and speeds up the release of safe products.
Why this approach improves data integrity
This workflow represents a "LIMS Lite" approach—offering the integrity of an enterprise system with the usability of a spreadsheet.
Traceability is the primary benefit. In a standard spreadsheet, macros (VBA) are often hidden, locked, or blocked by IT security policies. In Quadratic, the Python code is transparent. An external auditor can look at a cell and read exactly how the result was derived, from raw input to final calculation.
Version control is also significantly improved. Because the data processing, statistical analysis, and reporting happen in a unified environment, there are no broken links between multiple tabs or external files. The logic travels with the data.
Unlike a rigid LIMS where changing a report format requires a support ticket to the vendor, Quadratic allows the analyst to adjust the layout and presentation of the data just like a spreadsheet. You get the power of a coding environment, functioning as a powerful Python data analysis IDE, without losing the familiar interface.
Conclusion: Professional reporting without the headache
Moving your heavy metal food analysis from a fragile, multi-sheet workbook to a robust, automated tool does not require learning complex software development. It simply requires a tool that bridges the gap between data entry and data science, making Quadratic one of the best data science tools available.
You can produce professional, auditable reports that consolidate experimental data, statistical calculations, and regulatory assessments in one place. This ensures that when you sign off on a safety analysis, you have complete confidence in the numbers behind it.
To streamline your laboratory workflows and ensure data integrity, try building your next analysis template in Quadratic.
Use Quadratic to Streamline Heavy Metal Food Analysis
- Automate raw data ingestion directly from instrument files (e.g., CSVs) into the grid with Python, eliminating manual transcription errors and ensuring data integrity from the source.
- Perform rigorous statistical analysis for calibration curves, LOD/LOQ, and complex uncertainty budgets using native Python, making all calculations transparent and auditable.
- Centralize and automatically propagate uncertainty calculations across all samples, ensuring ISO 17025 compliance and preventing calculation errors.
- Implement dynamic pass/fail logic using Python to instantly compare results against regulatory limits, accelerating compliance checks and reporting.
- Maintain a clear, auditable chain of custody for all data transformations and analyses, crucial for regulatory compliance and external audits.
- Collaborate on analysis templates in a unified, browser-based environment, improving version control and eliminating fragile links common in traditional spreadsheets.
Ready to simplify your heavy metal food analysis workflows and boost data integrity? Try Quadratic.