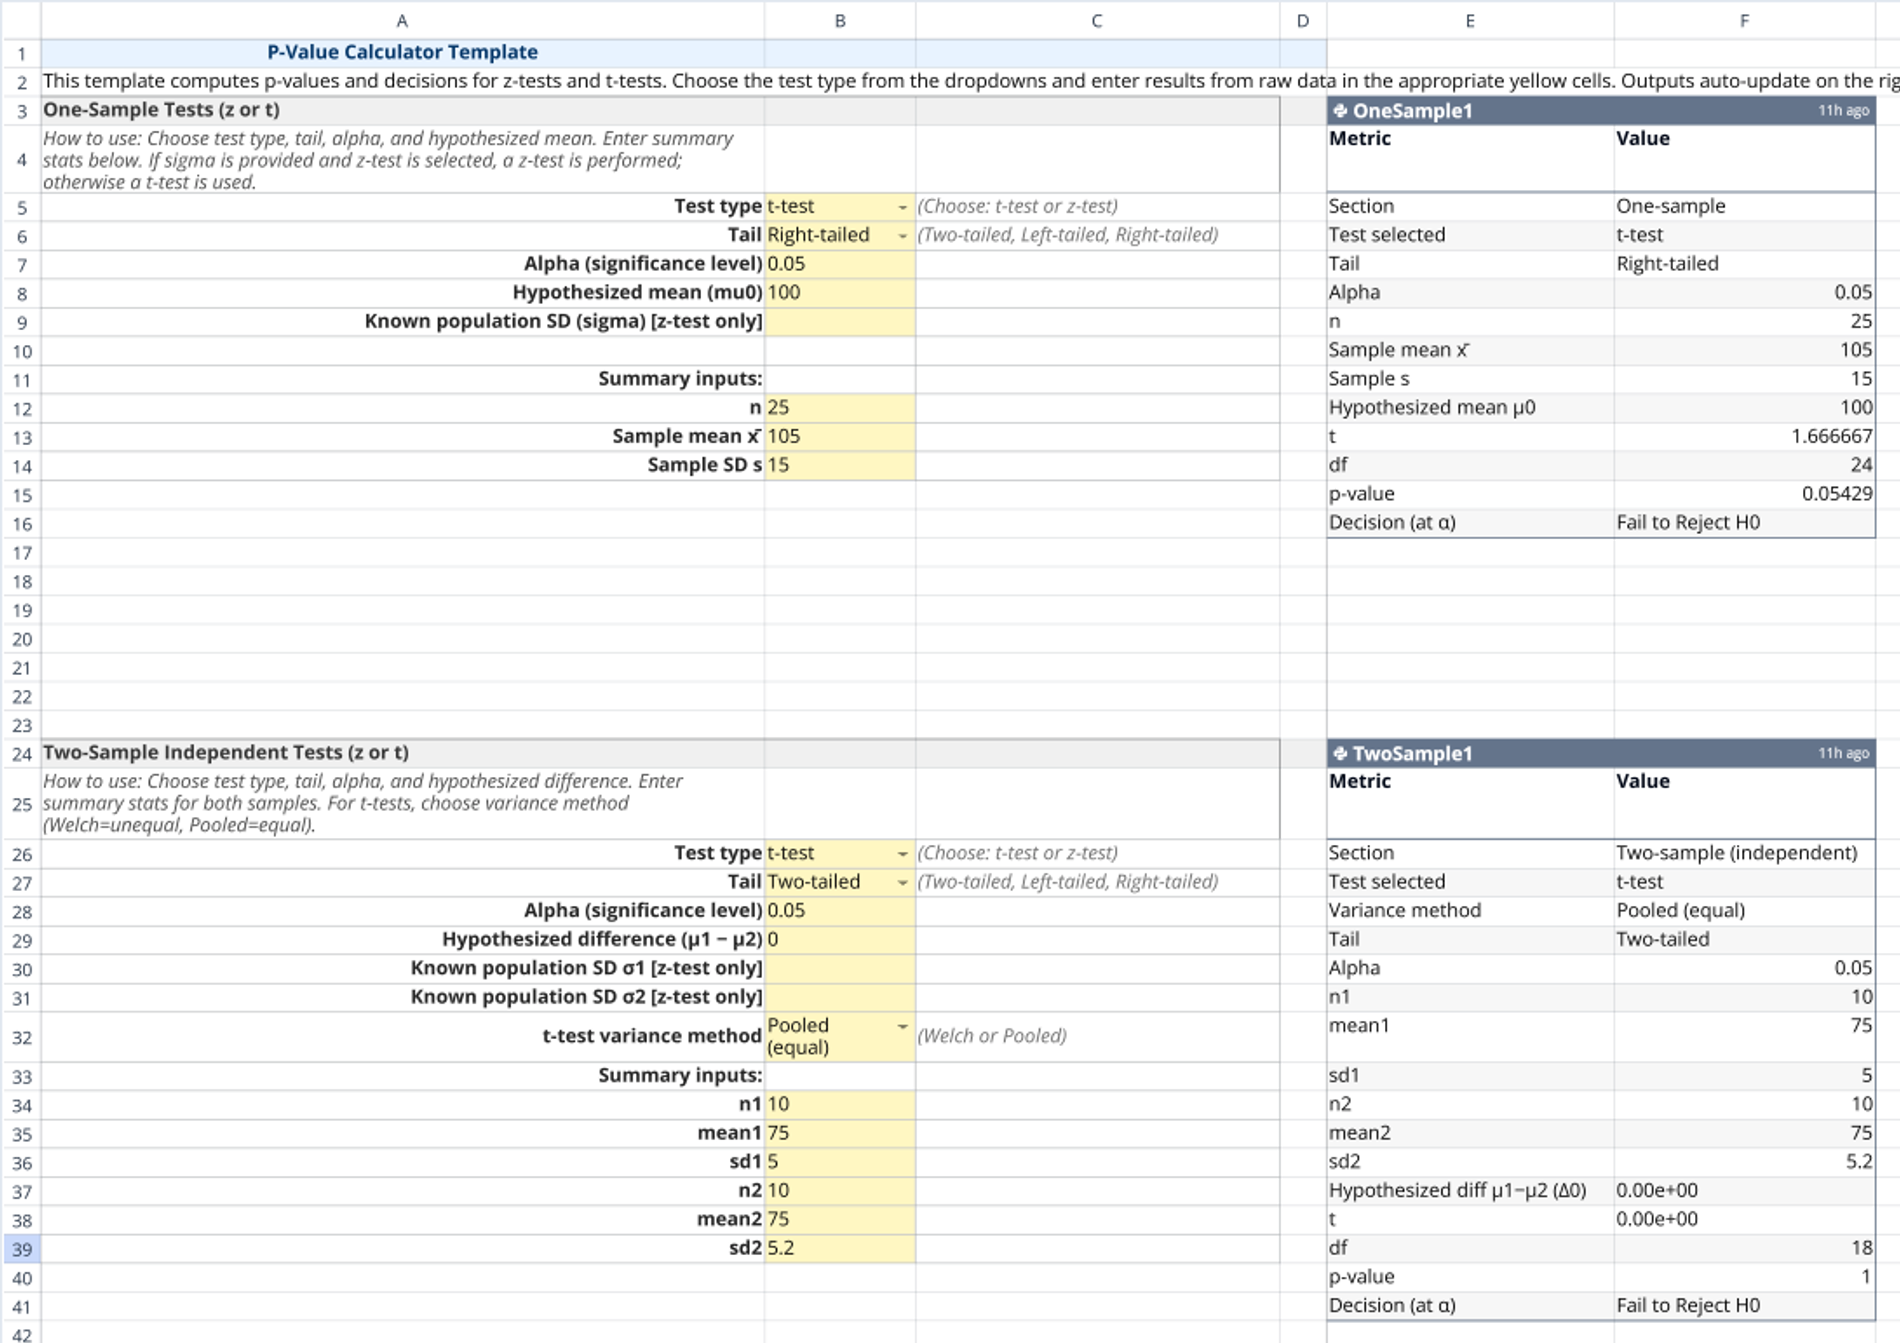
This template is a ready-to-use p value calculator designed to help you calculate p values for one-sample, two-sample (independent), and paired-sample tests. It guides you through inputs, runs the appropriate t-test or z-test, and presents the p-value, test statistic, degrees of freedom, and a clear “Reject/Fail to Reject” decision. Ideal when you need to calculate p value quickly from summary statistics, validate results, or replicate how to calculate p value from Excel without writing formulas.
Key benefits and scenarios
- Speed: Enter sample size, mean, and standard deviation—get instant results.
- Flexibility: Switch between one-sample, two-sample (Welch or Pooled), and paired-sample tests.
- Accuracy: Automated, consistent calculations reduce manual errors.
- Use cases: A/B tests, product benchmarks, before/after studies, academic labs, or QA checks.
How users interact
- Choose your test: Select t-test or z-test (z-test if population σ is known).
- Pick the tail: Two-tailed (most common), left-tailed, or right-tailed.
- Set alpha: Default 0.05, adjustable for your study.
- Enter summary stats: n, mean(s), SD(s); plus hypothesized mean/difference.
- Review outputs: The p-value calculator returns t/z, df, p-value, and decision automatically.
Tips and best practices
- Check assumptions: Independence, no extreme outliers, and approximate normality (t-tests are robust).
- Use Welch by default for unequal variances; use Pooled only if SDs are similar.
- If you usually do how to calculate p value in Excel, you can mirror the process here; the Instructions sheet includes references to AVERAGE and STDEV.S, helpful if you’re migrating from how to calculate p value from Excel workflows.
Who it’s for
- Analysts, researchers, educators, and students needing a calculating p value calculator for coursework or reports.
- Product, marketing, and ops teams running A/B tests or benchmark comparisons.
- Healthcare and manufacturing teams validating process changes or quality metrics. Real-life examples: Compare campaign results (Group A vs. B), test whether average processing time meets a target, or evaluate before/after training scores.
If you’re looking for a p-value calculator to calculate p value from summary data, this template makes it straightforward—no custom coding required.
Key highlights
- Multiple test types (one-sample, two-sample, paired)
- Welch vs. Pooled variance options
- Clear outputs and an assumptions checklist
- Spreadsheet-friendly design that feels familiar to Excel users
Try the template now to streamline your hypothesis testing, speed up analysis, and make confident, data-driven decisions.