
Table of contents
- What is the analytic hierarchy process?
- The challenge: From PDF reports to dynamic models
- Automating data ingestion with Python
- Reconstructing the model: The "reverse AHP" method
- Calculating consistency and rankings
- Why Python-integrated spreadsheets are superior for AHP
- Conclusion
- Use Quadratic to Modernize Your Analytic Hierarchy Process Workflow
Selecting the right electric vehicle (EV) fleet is rarely a linear decision. If it were based solely on the sticker price, the choice would be simple. However, fleet managers and data analysts must balance conflicting variables: battery range, charging infrastructure costs, maintenance lifecycles, and total cost of ownership (TCO) for electric vehicle fleets. When you add qualitative factors like driver comfort or brand reputation, a standard pros-and-cons list falls short.
To solve this, analysts turn to the Analytic Hierarchy Process (AHP), a structured framework for complex multi-criteria decision making. While the methodology is sound, the implementation often breaks down in traditional tools. The math is not the problem; the data engineering is.
Most analysts struggle not with the decision logic, but with the friction of data ingestion. Critical vehicle specifications and industry benchmarks are often locked in static PDF reports, requiring tedious manual entry into brittle spreadsheet templates. This article explores how to modernize this workflow by using Quadratic, a Python-integrated spreadsheet, to automate data ingestion, reconstruct decision matrices, and streamline the EV selection process.
What is the analytic hierarchy process?
Before diving into the technical implementation, it is helpful to clarify exactly what is analytical hierarchy process theory in the context of fleet management. Developed by Thomas Saaty, AHP is a method for organizing and analyzing complex decisions, based on mathematics and psychology. It allows decision-makers to structure a problem into a hierarchy, helping to quantify the weight of each factor.
The hierarchy typically consists of three layers:
1. The Goal: The ultimate objective, such as "Select the optimal EV fleet model."
2. The Criteria: The factors influencing the decision, such as Range, Cost, Charging Speed, and Warranty.
3. The Alternatives: The specific vehicle models being evaluated.
In a standard analytic hierarchy process AHP workflow, you perform pairwise comparisons. You compare criteria against each other (e.g., "Is Range more important than Cost?") and alternatives against each other regarding each criterion. These comparisons generate a matrix that yields weighted scores, helping you rank the best options mathematically rather than intuitively.
The challenge: From PDF reports to dynamic models
While the theory is clean, the reality of an analytical hierarchy process example in the corporate world is messy. As an analyst, you likely have a robust scoring template. However, the data required to populate that template—such as the latest battery degradation statistics or competitor weightings—often arrives in a PDF report from a consultancy or an internal research team.
In a traditional spreadsheet, this leads to significant friction. You are forced to manually type values from the PDF into cells, a process prone to human error. If you attempt to copy and paste tables, you frequently encounter spreadsheet mismatch errors where the source table dimensions do not align with your destination range. Furthermore, static Excel formulas are brittle; if the report adds a new vehicle model, you often have to rewrite your VLOOKUP or INDEX/MATCH formulas to accommodate the new row, risking broken references across the entire model.
Automating data ingestion with Python
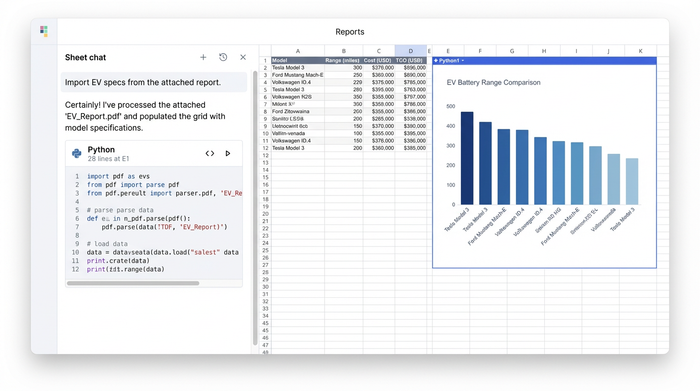
The most effective way to handle this data bottleneck is to move beyond manual entry and utilize Python directly within the spreadsheet. Quadratic allows users to write Python code in cells, enabling the automation of data ingestion tasks that would otherwise be manual.
Instead of typing numbers, an analyst can use Python libraries for PDF data extraction to parse data directly from a source, such as a CSV export or a pasted text block from a PDF. By treating the spreadsheet cell as a code block, you can structure the unstructured data into a clean DataFrame.
For an EV selection model, this means you can create a dynamic ingestion pipeline. When a new vehicle report is released, you simply update the source data, and the Python script automatically repopulates the criteria and specifications grid. This eliminates the risk of transcription errors and ensures that the downstream AHP calculations are always based on the most current data.
Reconstructing the model: The "reverse AHP" method
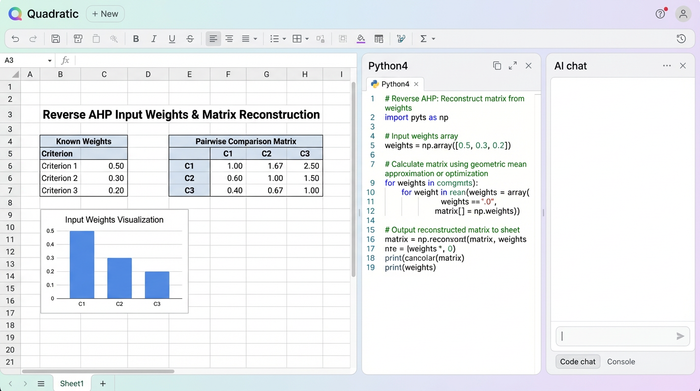
A specific, often overlooked challenge in this workflow occurs when you are given the answer but need to show the work. Sometimes, a high-level report will provide the final weights (e.g., "Battery Range is weighted at 40% importance") without providing the raw pairwise comparison matrix that led to that conclusion.
To build a fully functional analytic hierarchy process method model that allows for future sensitivity analysis, you need that matrix. This requires a technique often called "reverse AHP" methodologies.
Using Python within Quadratic, you can reverse-engineer or generate placeholder pairwise values that align with the provided weights. By writing a script that takes the known weights as inputs, you can mathematically reconstruct a consistent comparison matrix. This is critical for analysts who want to benchmark new vehicles against an existing industry standard found in a report. It allows you to plug new alternatives into a pre-validated weighting structure without needing access to the original raw data of the external report.
Calculating consistency and rankings
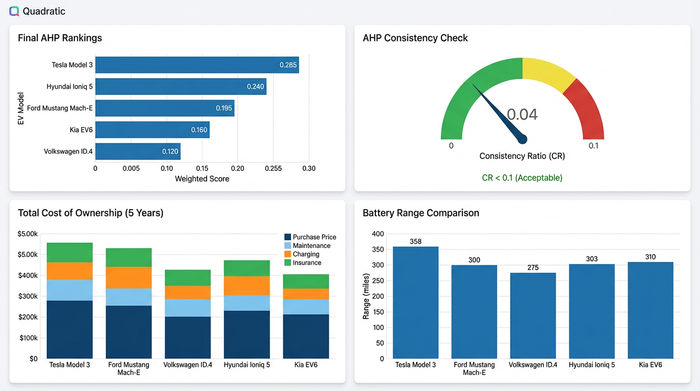
Once the data is ingested and the matrices are populated, the final step is processing the math. The analytic hierarchy process AHP method relies on matrix multiplication and the calculation of Eigenvalues to determine the Consistency Ratio (CR). The Consistency Ratio in AHP tells you if your pairwise comparisons are logically consistent or if they contain contradictions.
In standard spreadsheets, calculating Eigenvectors involves complex array formulas that are difficult to audit. In a Python-enabled environment, you can utilize libraries like NumPy to perform these linear algebra operations efficiently.
You can write a clear, readable script that:
1. Normalizes the pairwise comparison matrix.
2. Calculates the weighted averages.
3. Computes the Consistency Ratio to ensure validity.
4. Generates the final ranking of EV models.
This approach not only calculates the winner but also makes the logic transparent. Anyone reviewing the model can read the code to understand exactly how the rankings were derived, rather than tracing through hidden cell dependencies.
Why Python-integrated spreadsheets are superior for AHP
For complex decision-making frameworks like the analytic hierarchy process method, the integration of Python offers distinct advantages over traditional static spreadsheets.
The primary advantage is scalability. A static template might work for comparing three cars, but if you need to evaluate fifty different models across twenty criteria, standard formulas become unmanageable. A Python-backed model handles this scaling effortlessly, processing larger datasets without forcing the user to drag-and-drop formulas down thousands of rows.
Auditability is equally important. In complex MCDM models, logic often gets buried in nested formulas like =SUMPRODUCT(Sheet2!A1:B20...). This obscurity hides errors. In Quadratic, the logic is visible in the code, making it easier for teams to verify the methodology. Finally, the flexibility to mix SQL and Python allows analysts to connect their AHP models directly to live databases, turning a one-off analysis into a repeatable, automated decision engine.
Conclusion
The Analytic Hierarchy Process is a powerful tool for navigating the complexities of EV fleet selection, but its effectiveness is often limited by the tools used to implement it. When analysts are forced to manually bridge the gap between PDF reports and spreadsheet cells, they spend less time analyzing and more time typing.
By adopting a Python-enabled spreadsheet like Quadratic, decision-makers can automate the tedious aspects of the workflow. From ingesting messy data to reconstructing weighting matrices, Quadratic transforms the AHP framework from a static exercise into a dynamic, scalable solution. For fleet managers and analysts ready to move beyond manual entry, the future of decision-making lies in the grid that speaks code.
Use Quadratic to Modernize Your Analytic Hierarchy Process Workflow
- Automate data ingestion from messy sources: Directly parse EV specifications from PDF reports and other unstructured data using Python, eliminating manual entry and spreadsheet mismatch errors.
- Dynamically update AHP models: Build flexible models that automatically refresh criteria and alternatives when new EV reports are released, ensuring calculations are always based on current data.
- Reverse-engineer decision matrices: Reconstruct pairwise comparison matrices from known weights using Python, allowing you to benchmark new vehicles against existing standards for sensitivity analysis.
- Transparently calculate consistency and rankings: Leverage Python libraries like NumPy to efficiently compute Eigenvalues and Consistency Ratios, making your AHP methodology clear and auditable.
- Scale your analysis effortlessly: Evaluate dozens of EV models and criteria without managing complex, brittle formulas, handling large datasets with the power of Python.
- Connect AHP to live data: Integrate your decision models with live databases using SQL and Python, transforming one-off analyses into repeatable, automated decision engines.
Ready to streamline your complex decision-making? Try Quadratic.