
Table of contents
- Why traditional Excel dashboards fail at supply chain analytics
- Defining the core metrics for your dashboard
- Step 1: Ingesting and cleaning transactional data
- Step 2: Calculating complex KPIs (fill rates & delays)
- Step 3: Visualizing the data for leadership
- Get your dynamic template
- Conclusion
- Use Quadratic to build a logistics KPI dashboard
Every supply chain analyst knows the feeling of staring at a raw CSV export containing thousands of rows of transactional data. You have inconsistent receipt dates, mixed formatting in your delivery statuses, and the pressure to turn it all into a coherent report for leadership by the end of the day.
The instinct is often to search for a standard logistics KPI dashboard Excel template. While these templates provide a visual starting point, they rarely solve the underlying problem. As soon as your data format changes or a new vendor is added, the template breaks. You end up spending hours every week manually scrubbing data, fixing broken VLOOKUPs, and dragging formulas down thousands of rows just to get a snapshot of performance.
There is a better way to handle supply chain analytics. By using a code-powered spreadsheet like Quadratic, you can automate the heavy lifting. In this guide, we will walk through a real-world workflow: transforming raw procurement data into a dynamic logistics KPI dashboard that tracks fill rates, delays, and on-time delivery automatically.
Why traditional Excel dashboards fail at supply chain analytics
The primary reason most supply chain reports fail isn't a lack of data. It is the friction involved in cleaning that data. In a traditional spreadsheet, calculating a metric like "Average Days Late" requires perfect date formatting. If your ERP system exports dates as text strings or uses different formats for different vendors, standard formulas often return errors.
This leads to the "static trap." Because cleaning the data is so labor-intensive, analysts often build dashboards that are merely snapshots in time. To update the report for the next week, they have to repeat the entire manual process of filtering, formatting, and copy-pasting. This manual maintenance eats up time that should be spent on strategic analysis.
Quadratic solves this by allowing you to use Python directly within the spreadsheet grid. Instead of manually cleaning data every week, you write a short script to clean it once. When you drop in a new CSV file, your data cleaning rules run automatically, and your dashboard updates instantly.
Defining the core metrics for your dashboard
Before building the technical workflow, it is important to define what success looks like. A comprehensive logistics dashboard KPI strategy needs to balance cost metrics with efficiency metrics. For this specific use case, we will focus on three pillars of operational efficiency:
1. Fill Rate: This measures the percentage of customer demand met without stockouts. It is calculated by comparing the quantity ordered against the quantity actually delivered.
2. On-Time Delivery (OTIF): This tracks whether deliveries arrived on the promised date and in full. It is the gold standard for vendor performance.
3. Shipping Delays: This identifies the lag time between order placement and receipt, helping you spot bottlenecks in specific transport lanes.
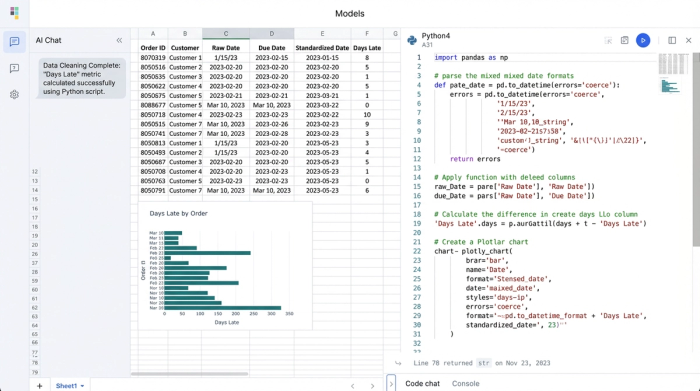
Step 1: Ingesting and cleaning transactional data
The first step in building your dashboard is handling the raw data. In our scenario, we have a CSV export containing columns for Order ID, Order Quantity, Receipt Date, Promised Date, and Delivery Status.
In a standard spreadsheet, you might struggle with the dates. Perhaps the "Promised Date" is in a US format (MM/DD/YYYY) while the "Receipt Date" is in an international format (DD/MM/YYYY).
In Quadratic, you can use Python to parse these dates instantly. By treating the data as a dataframe, you can write a simple script to convert both columns to a unified datetime format. Once the dates are standardized, you can calculate "Days Late" by simply subtracting the Promised Date from the Receipt Date. If the result is negative or zero, the shipment was early or on time. If positive, you have a quantifiable delay.
You can also normalize text data automatically. It is common for data entry errors to result in statuses like "shipped," "Shipped," and "SHIPPED" appearing as three different categories. Using Python, you can convert the entire column to lowercase in one step, ensuring your pivot tables and charts group these items correctly.
Step 2: Calculating complex KPIs (fill rates & delays)
Once the data is clean, the next step is calculating your performance metrics.
For Fill Rate, the logic involves comparing the Order Quantity against the Delivered Quantity. In a standard spreadsheet, you would write an IF statement and drag it down every row. If you have 50,000 rows, this can slow down your file significantly. In Quadratic, Python performs this calculation across the entire dataset instantly. You can create a new column that calculates the fill percentage and flags any order below 100%.
To handle On-Time Delivery, you can categorize your "Days Late" calculation. You can write logic that tags an order as "On Time" if the delay is less than or equal to zero, and "Late" if it is greater than zero.
This approach also allows for powerful filtering. You can create a specific data view that filters the dataset to show only rows where the status is "Overdue" or where the Fill Rate is below 90%. This allows you to identify critical issues immediately without scrolling through thousands of healthy orders.
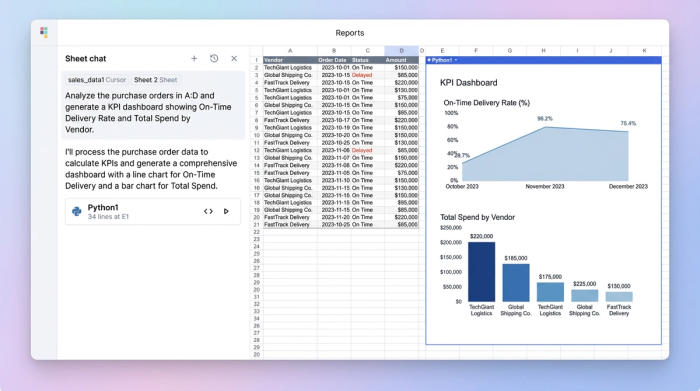
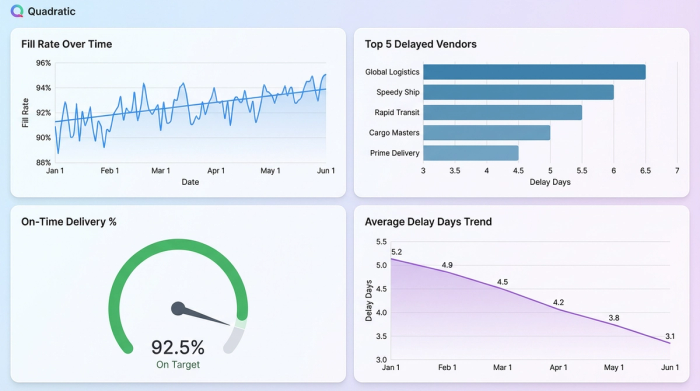
Step 3: Visualizing the data for leadership
The final step is presenting these insights in a format that leadership can use to make decisions. An executive dashboard needs to be clean, visual, and focused on trends.
Using the clean data you prepared in the previous steps, you can generate charts that show "Fill Rate Trends over Time" or a bar chart displaying the "Top 5 Delayed Vendors." Because the underlying data is already structured, these visualizations are robust.
This flexible structure also makes your dashboard future-proof. If leadership decides they want to track returns next quarter, you can easily add a reverse logistics KPI dashboard section. You would simply import the returns data, join it with your existing order data using Python, and visualize the rate of returns and damages. You do not need to rebuild the entire file; you just add the new logic to your existing workflow.
Get your dynamic template
If you are currently searching for a supply chain & logistics KPI dashboard Excel template free of charge, you might be setting yourself up for more manual work than necessary. Static templates require you to adapt your data to fit their structure.
A better approach is to use a dynamic template in Quadratic. This offers the familiarity of a spreadsheet interface but eliminates the manual maintenance. You can fork a Quadratic example dashboard, upload your own CSVs, and watch your KPIs calculate instantly. This allows you to move from data entry to data analysis, giving you the time to focus on improving supply chain efficiency rather than fixing broken formulas.
Conclusion
Building a robust logistics KPI dashboard is about more than just making pretty charts. It is about creating a reliable workflow that transforms messy transactional data into clear insights without requiring hours of manual grunt work every week.
By using a tool that automates data cleaning and calculation, you ensure that your metrics—from fill rates to shipping delays—are always accurate and up to date. This shifts your role from a report generator to a strategic partner, capable of providing the real-time visibility your organization needs to optimize its supply chain.
Use Quadratic to build a logistics KPI dashboard
- Clean messy logistics data—including inconsistent dates and varied text formats—automatically with Python scripts, eliminating manual scrubbing and broken formulas.
- Automate complex KPI calculations like fill rates, on-time delivery, and shipping delays across thousands of rows instantly, ensuring your dashboard updates automatically with fresh data.
- Transform raw transactional data into dynamic, always-current dashboards without repetitive manual work, freeing you to focus on analysis rather than maintenance.
- Easily filter and focus on critical issues like overdue shipments or low fill rates, enabling rapid operational adjustments.
- Future-proof your analytics by seamlessly integrating new data sources or metrics without rebuilding your entire dashboard from scratch.
Ready to build a dynamic logistics KPI dashboard that updates itself? Try Quadratic.