Table of contents
Educators and academic administrators often find themselves trapped in a data entry cycle. You spend hours inputting grades into a spreadsheet, but by the time the data is entered, there is little time left to analyze it or plan interventions. The traditional gradebook is a passive storage container, but modern education demands an active system. You need a student performance dashboard—a tool that not only records scores but immediately flags at-risk students and suggests next steps, often integrating an attendance sheet template for a complete view.
Many professionals attempt to build a student performance dashboard in Excel, only to find that the formulas break easily or become impossible to maintain as the semester progresses. Others turn to a power bi student performance dashboard, which offers great visuals but requires a steep learning curve and separates the data entry from the analysis.
Quadratic offers a middle ground that is powerful yet accessible, positioning it among the best data science tools for educators. By combining the familiarity of a spreadsheet with the logic of Python and an infinite canvas for visualization, you can build a robust tracking system. This guide will walk you through creating an automated RAG (Red-Amber-Green) grading system that handles logic, visualization, and intervention planning in one workspace.
Why move from a gradebook to a dashboard?
The primary difference between a gradebook and a dashboard is actionability. A gradebook tells you what happened in the past. A student performance dashboard tells you what needs to happen now. To make this shift, we utilize the RAG system, a visual management technique used in project management and healthcare, adapted here for academic performance tracking.
- Red: The student is failing or critical. Immediate intervention is required.
- Amber: The student is borderline or slipping. Monitor closely.
- Green: The student is on track or excelling.
Large institutions, such as the University of Washington School of Medicine, utilize complex uwsom student performance dashboards to track competency across years of study. However, you do not need an enterprise engineering team to get similar results. In Quadratic, you can build a custom, professional version for your specific classroom or department that updates automatically the moment you type in a new test score.
Step 1: Setting up your data structure
The foundation of your dashboard is a clean, raw data grid. In Quadratic, this will be the only area where you manually enter data. Every other part of the dashboard—grades, feedback, and charts—will flow downstream from this source.
Start by creating columns for the essential identifiers and assessment scores. You will likely need columns for Student Name, Student ID, and Subject. Following these, set up columns for your assessments, such as Test 1, Test 2, Midterm, and Final, often managed effectively with an assignment tracker template.
This structure allows you to treat the grid as a database. Because Quadratic handles data efficiently, you do not need to worry about formatting this raw area to look pretty. Its sole purpose is to hold the scores. Once this is set up, you can stop calculating grades in your head or manually, especially with a dedicated college GPA calculator.
Step 2: Automating logic with Python
This is where the limitations of a standard student performance dashboard excel template usually appear. In a traditional spreadsheet, assigning a letter grade to a numerical score requires nested IF formulas. These look like =IF(A1>90,"A",IF(A1>80,"B"...)) and are notoriously difficult to read or debug. If you need to change your grading scale, you have to rewrite the formula in every single cell.
In Quadratic, we replace fragile formulas with Python, effectively turning your data into a python spreadsheet. You can write a simple Python function directly in the cell that maps scores to grades.
For example, you can define a function that takes a numerical score as an input. Inside the function, you write clear logic: if the score is greater than or equal to 90, return "A"; if it is between 80 and 89, return "B", and so on.
Once this logic is written, you apply it to your entire column of scores. The benefit is significant. It is a "set it and forget it" workflow. If you sort your rows or add new students, the Python logic remains intact and accurate. You are no longer managing formulas; you are managing a system.
Step 3: Visualizing the RAG status
Now that the logic is calculating grades, you need to make the data visually immediate. A teacher should be able to scan the dashboard and instantly identify "heat spots" where students are struggling.
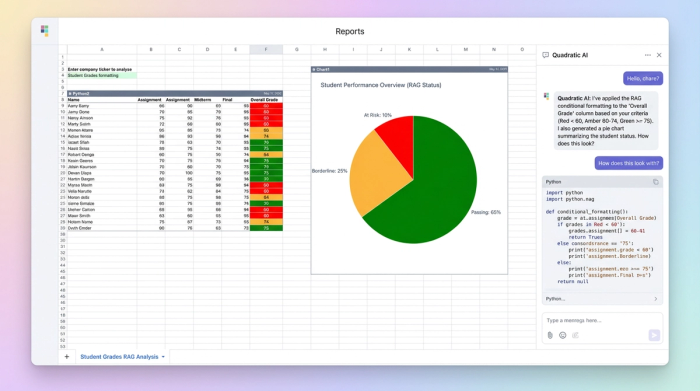
Using conditional formatting, you can apply the RAG methodology directly to the grade columns. You can set rules that automatically highlight failing grades in red, borderline grades in yellow or amber, and passing grades in green.
This visual cue changes the way you interact with the data. Instead of reading row by row, your eye is drawn to the red cells. This allows for rapid triage, ensuring that no student falls through the cracks simply because their low score was buried in a sea of data.
Step 4: Building the summary dashboard
When users search for a student performance dashboard power bi, they are usually looking for high-level charts and graphs that summarize class health. In Power BI, this requires exporting your data to a different piece of software. In Quadratic, you can build these visuals right next to your data on the infinite canvas.
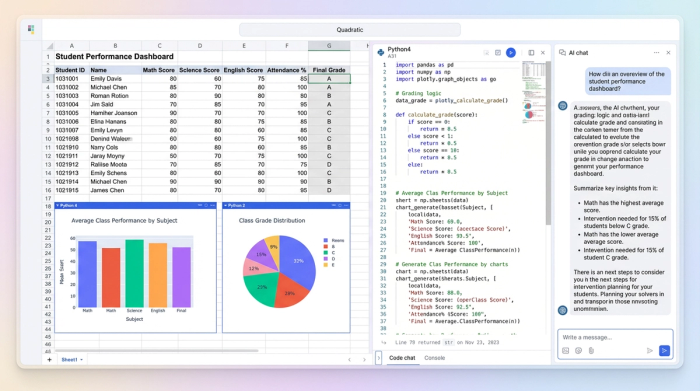
You should aim to display three key metrics to get a complete picture of class performance:
1. Class Averages: Use standard formulas to calculate the mean scores for each assignment. This helps you identify if a specific test was too difficult.
2. Pass/Fail Rates: A pie chart showing the percentage of the class passing versus failing provides a quick health check for the cohort.
3. Subject Breakdown: If you track multiple subjects, a bar chart comparing performance across them can highlight curriculum strengths and weaknesses.
Because Quadratic uses an infinite canvas, you can arrange these charts to the right of your data grid. This creates a professional, cohesive look where the detailed data and the high-level summaries live side-by-side.
Step 5: Automating intervention planning
Research into academic performance tracking highlights a gap in providing narrative feedback. Numbers tell you a student failed, but they do not tell you what to do about it.
You can close this gap using Python in Quadratic. Create a new column called "Recommended Action." In this column, write a Python script that looks at the student's score and generates a specific text string based on the result.
For example, if a student scores below 60, the cell can automatically output: "Schedule 1:1 meeting for remedial review." If the score is between 60 and 70, it might output: "Assign supplementary practice exercises."
This transforms your dashboard from a passive report into an actionable to-do list, enabling more effective automated intervention planning. You are no longer just looking at a bad grade; you are looking at a generated plan to fix it.
Conclusion
By following these steps, you have moved far beyond a standard spreadsheet. You have built a dynamic student performance dashboard that tracks grades, visualizes student health through RAG indicators, and automates intervention planning.
This system saves time on manual calculations and ensures that your focus remains where it belongs: on teaching and supporting your students. You do not need to struggle with fragile formulas or learn complex business intelligence software to get these results. You simply need a tool that combines data, logic, and visuals in one place. You can start building your own dashboard in Quadratic today and turn your data into action.
Use Quadratic to build a student performance dashboard
- Automate complex grading logic and RAG (red-amber-green) status indicators using Python, eliminating fragile spreadsheet formulas.
- Instantly visualize student performance with conditional formatting and dynamic charts on an infinite canvas, making at-risk students immediately visible.
- Generate specific, actionable intervention plans automatically based on student scores, transforming data into a clear to-do list.
- Keep all your raw grades, analytical logic, and summary dashboards in one collaborative workspace, streamlining your entire tracking workflow.
- Build a robust, self-updating system that remains accurate as you add new data or students, freeing you from manual recalculations.
Ready to transform your gradebook into an active, intelligent dashboard? Try Quadratic.