
The search for the perfect productivity system is often a journey of compromise. You want to visualize your progress and maintain consistency, but the tools available usually force you to choose between flexibility and structure. On one hand, you have rigid mobile apps that lock you into their specific way of doing things. On the other, you have the classic spreadsheet—a blank canvas that often becomes a cluttered nightmare when you try to track a full month of granular activity.
This is the organized user's dilemma. Most people who attempt to build a daily habit tracker in a standard spreadsheet end up with a single sheet containing 30 or 31 columns extending endlessly to the right. It requires constant horizontal scrolling and makes it difficult to focus on the day ahead. While you might search for a Google Sheets daily habit tracker template to solve this, you will likely find that they rely on complex, fragile formulas to function.
There is a better way to organize your life. By using Quadratic, the Python spreadsheet, you can build a system that functions like a daily habit tracker journal—giving you a fresh, clean tab for every single day—while retaining the analytical power of a daily habit tracker app. This approach uses Python to automatically aggregate data from dozens of daily tabs into a single master dashboard, solving the technical headaches that usually plague multi-tab spreadsheets.
The architecture: why use a multi-tab approach?
The most effective productivity systems, often built on a foundation of structured personal infrastructure, are those that reduce friction. When you sit down to plan your day, you want a focused environment, not a massive grid filled with data from two weeks ago. This is why the multi-tab architecture is so powerful.
In this workflow, every day of the month gets its own dedicated tab. This allows for a level of detail that simply isn't possible in a single-sheet view. Instead of just marking an "X" for a completed habit, you can track specific details: the category of the task, the priority level, the time spent, and the completion status.
This method offers a significant advantage over a static daily habit tracker printable, which cannot calculate progress or trends, and a Notion daily habit tracker, which can become sluggish when databases grow too large. In Quadratic, you get the clean, distraction-free interface of a fresh page combined with the computational power of code. You can treat each tab as a daily planner, and let the software handle the heavy lifting of summarizing your month.
Step 1: designing the daily template
The first step is to create the structure for a single day. This will serve as your master template, which you will duplicate each morning.
Start by creating a new tab and naming it "Template" or "Jan 1". In this sheet, set up your columns to capture the data that matters most to your workflow. A robust setup usually includes:
- Task Name
- Category (e.g., Work, Health, Learning)
- Priority (High, Medium, Low)
- Status (Done, Pending)
- Duration (Minutes or Hours)
Once the columns are set, you can pre-fill the sheet with the core daily habits to track. These might include "Deep Work Session," "Exercise," "Reading," or specific professional deliverables. The goal is to make this tab look and feel like a page from a grit daily habit tracker planner—minimal, focused, and ready for input. Because this is just one day's worth of data, you don't need to worry about overcrowding the screen. You have the space to add notes, reflection, or additional context for each task.
Step 2: the dashboard (the "impossible" Excel task)
This is the pivotal moment where standard spreadsheets usually fail. If you have 30 separate tabs named "Jan 1" through "Jan 30," creating a master dashboard in Excel or Google Sheets is incredibly difficult. You would typically need to write complex INDIRECT formulas or manually link cells from every single tab. If you decided to add a new tab for "Jan 31," you would have to update your dashboard formulas manually.
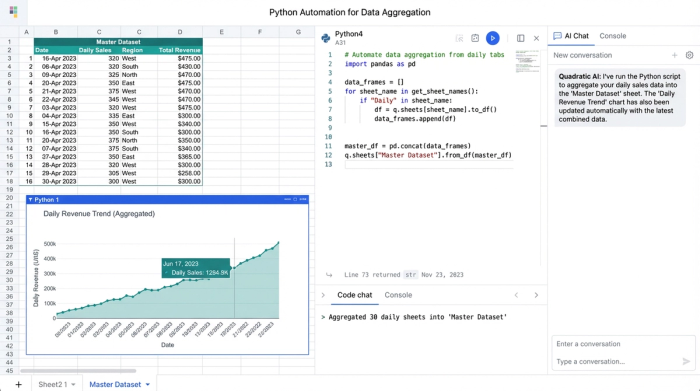
In Quadratic, this problem is solved with a simple Python script. Because Quadratic runs Python natively in the grid, you can write a script that "loops" through your workbook.
The logic is straightforward. You create a new tab called "Dashboard." In a single cell, you write a Python script that tells the system: "Go through every tab in this workbook. If the tab has data in the 'Status' and 'Duration' columns, pull that data into a list," effectively automating data aggregation with Python.
This script instantly aggregates 30 days of scattered data into a single, clean dataset on your dashboard. The best part is the automation. If you duplicate your template to create a new day, the Python script automatically detects the new tab and includes its data in the totals. You never have to touch the formulas again.
Step 3: visualizing your progress
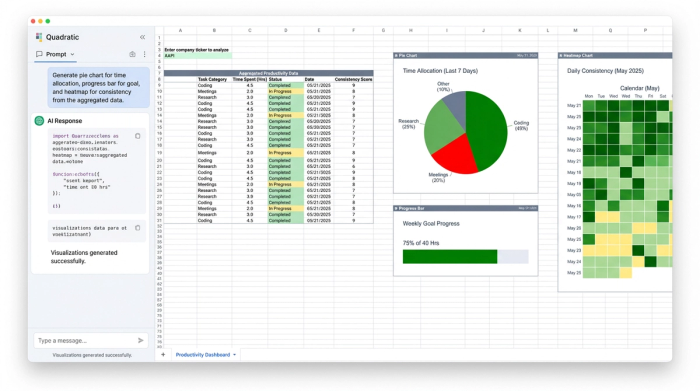
With your data automatically aggregated by Python, you can now build the visualizations that offer the psychological benefits of visual progress tracking and keep you motivated. This transforms your spreadsheet from a simple list into a dynamic daily habits tracker.
Since all your data is now in one dataframe (a table structure in Python), you can easily generate charts to visualize your performance.
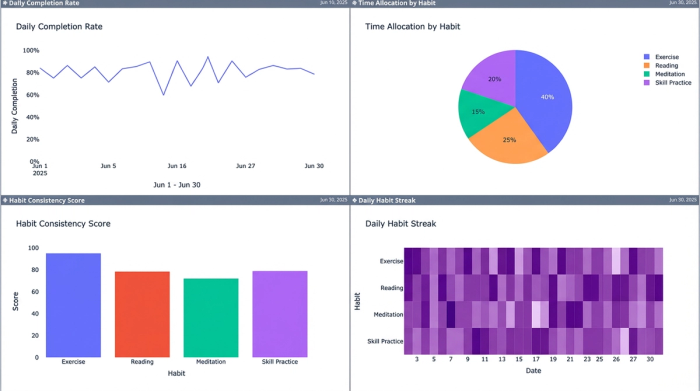
- Completion Rate: Create a progress bar or gauge chart that shows the percentage of tasks marked "Done" for the current month.
- Time Allocation: Use a pie or donut chart to visualize how much time you spent on "Work" versus "Wellness" or "Personal Projects."
- The Streak: One of the most popular daily habit tracker ideas is the "streak" visualization. You can create a heatmap that darkens based on the number of tasks completed each day, giving you an at-a-glance view of your consistency.
These visuals provide immediate feedback. Unlike a paper journal where you have to flip back through pages to gauge your consistency, this dashboard, built adhering to principles for effective performance dashboards, offers a real-time health check of your productivity.
Step 4: automating the workflow
Once the system is built, the daily routine is seamless. Your workflow looks like this:
1. Open your Quadratic workbook.
2. Right-click your "Template" tab and select Duplicate.
3. Rename the new tab to today's date.
4. Log your tasks, check off your habits, and enter your time.
5. Click over to the Dashboard tab to see your charts update instantly.
This workflow satisfies the desire for a sophisticated daily habit tracker that offers visual gratification without the high-friction setup of maintaining complex spreadsheet links. You get the satisfaction of a fresh start every morning and the strategic insight of a monthly review, all in one place.
Conclusion
By leveraging the power of Python within a spreadsheet, you have built a tool that adapts to your life rather than forcing your life into a pre-made box. You no longer have to choose between the simplicity of a daily journal and the analytical power of a data dashboard. This automated daily habit tracker grows with you, handling the complex data aggregation in the background so you can focus on checking off tasks and maintaining your streak, supported by research on habit tracking effectiveness.
If you are ready to move beyond static templates and rigid apps, try building this workflow in Quadratic. It is the most effective way to learn Python with zero knowledge and experience how code-integrated spreadsheets can turn a manual chore into an automated, insightful system.
Use Quadratic to build an automated daily habit tracker dashboard
- Create a clean, focused daily view: Get a fresh, dedicated tab for each day, eliminating horizontal scrolling and clutter common in traditional spreadsheets, making it easy to log specific habits and details.
- Automatically aggregate daily data: Use Python to effortlessly pull data from all your daily tabs into a single master dashboard, avoiding complex, fragile formulas and manual linking.
- Visualize progress with ease: Generate dynamic charts and heatmaps (like completion rates, time allocation, and streaks) from your aggregated data to see your consistency and stay motivated.
- Automate your workflow: Duplicate a daily template and let Quadratic automatically include new days' data in your dashboard, ensuring your tracker grows with you without manual updates.
- Combine daily journaling with powerful analytics: Enjoy the simplicity of a fresh daily page for input alongside the computational power of a code-integrated spreadsheet to analyze your monthly progress.
Ready to track your habits smarter? Try Quadratic.