
Table of contents
- The challenge of preparing data for Election Result Analysis
- Step-by-step: extracting and cleaning electoral rolls in Quadratic
- From extraction to insight: performing the Election Results Analysis
- Why a code-enabled spreadsheet wins for public data
- Conclusion
- Use Quadratic to prepare election results data from PDFs
For data analysts, journalists, and political strategists, the most time-consuming part of election results analysis usually isn't the analysis itself, often adhering to the 80/20 rule of data science. It is the grueling process of data preparation. While the end goal is to uncover trends, visualize voter demographics, or map district density, the starting point is often a locked, unformatted government-issued PDF.
Electoral rolls are notoriously complex documents, often presenting statistical issues of administrative data. They often span hundreds of pages, contain inconsistent headers, and combine distinct data points—like a voter’s name and their relative’s name—into single cells. To perform accurate election results analysis, you need granular, structured data, but the "dead" format of a PDF stands in the way.
In this walkthrough, we will explore how to bypass the limitations of standard PDF converters and manual data entry. We will demonstrate a workflow using Quadratic, a code-enabled spreadsheet, to ingest raw electoral rolls, apply Python cleaning logic directly in the grid, helping users to learn Python for data analysis, and generate a pristine master dataset ready for immediate insight.
The challenge of preparing data for Election Result Analysis
Before you can calculate swing percentages or voter turnout, you need a clean dataset. However, public records are rarely released in machine-readable formats like CSV or JSON. They are almost exclusively published as PDFs designed for printing, not for digital processing.
When analysts attempt to bridge this gap using standard tools, they often encounter significant friction, which is why many turn to Python and natural language processing tools for extracting, cleaning, and organizing data from PDFs. Traditional PDF converters (like Adobe or online tools) focus on visual fidelity rather than data structure. They might successfully convert a page into Excel, or even try to convert pdf to spreadsheet, but they often fail to recognize table borders correctly.
The alternative—manual copy-pasting—is unscalable when dealing with electoral rolls that contain thousands of voters across dozens of polling stations.
This creates a "logic gap." Even if you manage to extract the text, the data is usually dirty. A single cell might contain "Doe, John (Father: Doe, James)." To perform meaningful election result analysis, you need to separate the voter from the relative, extract the specific relationship type, and isolate the Voter ID. Standard spreadsheets require complex, brittle formulas to handle this. By introducing Python directly into the spreadsheet interface, we can treat this cleanup as a programmable, reproducible workflow.
Step-by-step: extracting and cleaning electoral rolls in Quadratic
The following workflow demonstrates how a user can move from a raw PDF to a structured database of voters including part number, serial number, voter ID, name, relative’s name, address, age, and gender.
1. Ingesting multi-page PDFs
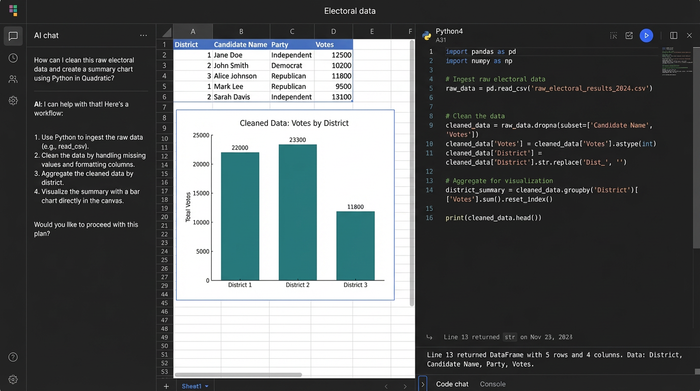
The first step in the workflow is getting the data into the grid. In a standard spreadsheet, you might have to import the PDF page by page or rely on a third-party plugin. In Quadratic, you can bring the file directly into the environment.
Instead of manually selecting tables, we use a Python cell to read the PDF. By utilizing Python libraries available within Quadratic, you can write a script that iterates through every page of the document. The script identifies the table structures on each page and pulls the raw data into a DataFrame.
The immediate benefit here is visibility. As soon as the script runs, the data populates the spreadsheet grid. You can instantly see if the PDF extraction captured the headers correctly or if specific pages require different handling, allowing for a tight feedback loop between code and data.
2. Cleaning and splitting combined fields
Once the raw data is in the grid, the real work of cleaning electoral rolls begins. Government PDFs often save space by combining fields. A common example in electoral data is the "Father/Husband Name" column, where the relative's name and the relationship type are jammed into one string.
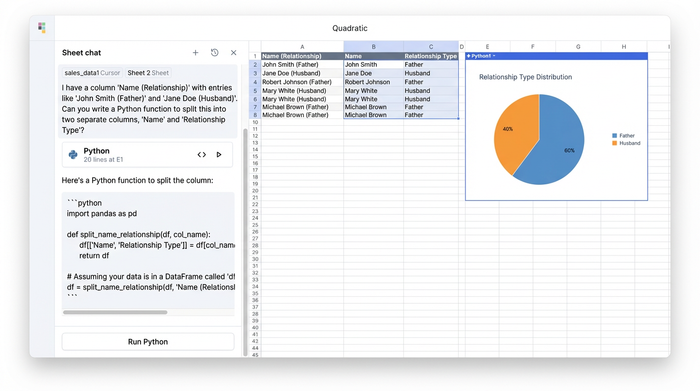
Using Python directly in the grid, you can write a cleaning function to parse these strings. For example, you can use Pandas to split the column based on delimiters or keywords, creating two distinct columns: "Relative Name" and "Relationship Type."
Similarly, extracting specific identifiers like the Voter ID or Serial Number often requires looking for patterns within a text block. You can apply Regular Expressions (Regex) to scan the raw text and pull out alphanumeric codes that match the Voter ID format, discarding the surrounding noise.
Finally, standardization is critical for aggregation. If the PDF uses "M", "Male", and "M." interchangeably, your pivot tables will be inaccurate. A simple Python dictionary mapping can instantly standardize these values to a single "M" or "F" across the entire dataset, ensuring gender distribution analysis is accurate.
3. Creating the master table
The final step in the preparation phase is merging the data from hundreds of individual pages into a single, cohesive dataset. In a manual workflow, this involves risky copy-pasting where rows can be dropped or misaligned.
In Quadratic, because the data is held in DataFrames, you can concatenate the extracted tables from all pages into one "Master Table." During this process, you can enforce data integrity, ensuring that the column order—Part Number, Description, Address, Age—remains consistent. The result is a single, scrollable, and queryable dataset that sits in your spreadsheet, ready for the actual election results analysis.
From extraction to insight: performing the Election Results Analysis
With a clean, unified master table, the focus shifts from data janitorial work to genuine insight. Because the data is now granular—with separate columns for every variable—you can perform sophisticated analysis that was impossible with the raw PDF.
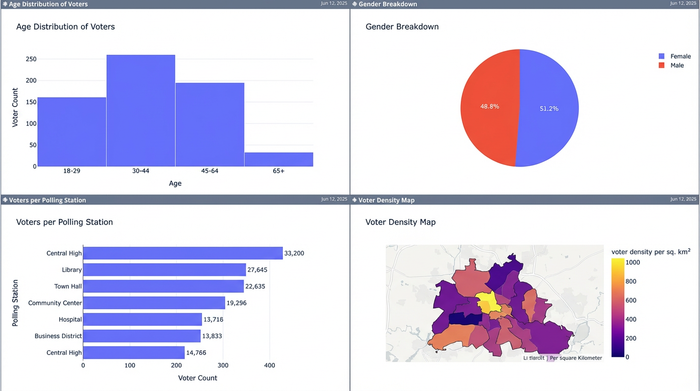
You can now easily run demographic breakdowns to visualize the age and gender distribution per polling station. You can identify potential duplicate voters by cross-referencing names and ages across different part numbers. If the address data was successfully parsed, you can even begin mapping voter density to understand geographic trends within the constituency.
Accurate election results analysis relies entirely on this level of data granularity, underscoring the need for precinct-level election results to derive meaningful insights. By automating the cleanup process, you ensure that your insights are based on reliable, standardized facts rather than estimated figures derived from messy documents.
Why a code-enabled spreadsheet wins for public data
For professionals handling public record data, the shift to a code-enabled spreadsheet offers advantages that go beyond simple convenience.
The primary advantage is reproducibility. Electoral rolls are updated frequently. If the election commission releases a revised PDF a week before the election, a manual workflow would require starting over from scratch. In Quadratic, you simply replace the source file and re-run your Python script. The logic for splitting names, extracting IDs, and standardizing gender is applied automatically, updating your analysis in seconds.
This approach also offers transparency. In a black-box PDF converter, you don't know how the software decided where a column ends. In Quadratic, the cleaning logic is visible in the code cell right next to the data. This allows for easier auditing and verification, which is essential for journalists and researchers who must defend their methodology.
Conclusion
The gap between a government PDF and a clear analytical insight is often filled with hours of tedious manual labor. By moving this workflow into Quadratic, we transform a disconnected, multi-step process into a streamlined pipeline. We successfully converted a complex, multi-page electoral roll into a structured dataset, standardizing messy fields and merging disparate pages without ever leaving the spreadsheet.
If you are tired of fighting with formatting and want to focus on the actual election results analysis, it is time to stop manually copying and pasting. Try Quadratic to automate your data extraction workflow and turn static documents into dynamic data.
Use Quadratic to prepare election results data from PDFs
- Automate complex PDF data extraction: Directly ingest multi-page electoral rolls into a live grid using Python, bypassing manual copy-pasting and the limitations of standard converters.
- Clean and structure messy electoral data with code: Apply precise Python logic in the spreadsheet to split combined fields (e.g., voter name and relative), extract specific IDs (Voter ID, Serial Number), and standardize inconsistent entries (e.g., gender) across thousands of records.
- Create a unified, analysis-ready master dataset: Concatenate data from hundreds of individual PDF pages into a single, cohesive table, ensuring data integrity and preparing it for immediate demographic breakdowns, duplicate checks, or geographic mapping.
- Ensure reproducibility and transparency: Update your analysis instantly by simply replacing source PDFs and re-running your Python scripts, with all data cleaning logic visible and auditable directly within the spreadsheet.
Stop fighting with messy documents and start analyzing. Try Quadratic.