
Table of contents
Financial localization is often misunderstood as simple currency translation. In reality, it is a complex, multi-layered process of adapting financial statements to meet specific regional standards, regulatory frameworks, and reporting nuances. For accountants and financial controllers, the challenge lies in bridging the gap between General Accepted Accounting Principles (GAAP) in one region and International Financial Reporting Standards (IFRS) in another, all while managing tax implications and currency fluctuations.
The stakes are high. Local financial institutions and advisory firms face increasing pressure to deliver consolidated multi-region data with speed and absolute accuracy. Traditionally, this process involves exporting data from a rigid ERP system into a spreadsheet, where the manual work begins. This is where the workflow often breaks down. Static spreadsheets are prone to human error, version control issues, and broken links. Quadratic, the Python Spreadsheet, offers a different approach: programmable financial reporting. By combining the familiarity of a coding spreadsheet with the power of Python—a language recognized for its flexibility in ERP systems—finance professionals can automate the logic behind financial localization, ensuring that compliance is built directly into the code.
Why traditional spreadsheets fail at financial localization
The most significant risk in manual localization is the "copy-paste" error. When an accountant manually looks up an exchange rate and hard-codes it into a cell, that data becomes static. If the report needs to be updated a week later, that figure is likely obsolete, requiring a manual audit of every cell to ensure accuracy. For complex entities operating across borders, this manual maintenance is unsustainable.
There is also a significant compliance gap. Local financial advisors often need to justify specific adjustments to auditors or clients. In a traditional spreadsheet, the logic for an adjustment is often hidden inside a complex, nested cell formula that is difficult to read and nearly impossible to debug. If a formula breaks, it fails silently, potentially compromising the entire report.
This operational fragility directly impacts client trust. While marketing strategies like local SEO for financial advisors are essential for business growth and attracting new clientele, the operational backbone of a firm relies on accurate, scalable reporting. Retention is driven by the quality and reliability of the advice provided. If a firm cannot guarantee the integrity of its localized reports because of spreadsheet errors, no amount of marketing can repair that reputational damage.
The modern workflow: automating the "big three" statements
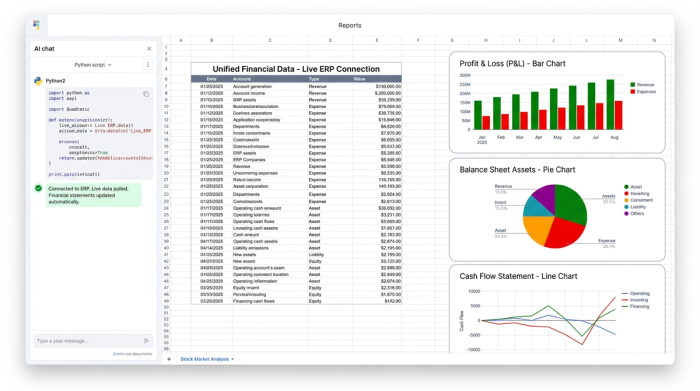
The solution to fragile reporting is unified data. In a programmable environment like Quadratic, accountants can build the "Big Three"—Balance Sheet, Profit & Loss, and Cash Flow—on a single, infinite canvas without relying on fragile inter-workbook links.
Consider an accountant tasked with consolidating reports for a multi-region entity. Instead of manually downloading CSVs and pasting them into tabs, they can use SQL connectors within Quadratic to pull live data directly from the company’s database or ERP. This ensures data realism. When the source data changes, the financial statements update automatically. The formatting remains intact, and the logic flows through the document instantly. This shift from static data entry to dynamic data flows, enabled by automated data processing, allows finance teams to focus on analysis rather than data cleaning.
Automating currency conversion with Python
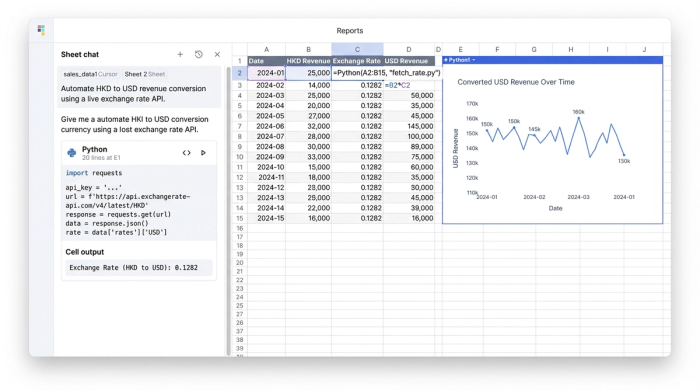
One of the most tedious aspects of local financial reporting is currency conversion, requiring adherence to best practices for multi-currency financial management. Manually retrieving exchange rates for different dates and entering them into a spreadsheet is a slow, low-value task that introduces a high risk of error.
In Quadratic, this process is automated using Python. Instead of a static number, a user can write a simple Python script directly in a cell to fetch exchange rates. Using libraries like forex-python or connecting to a financial API, the spreadsheet can pull the exact exchange rate for the specific date of the transaction.
For example, a cell representing revenue in Hong Kong Dollars can automatically convert to US Dollars based on the closing rate of the reporting period. This creates an automatic audit trail. Anyone reviewing the spreadsheet can look at the code and see exactly where the rate came from, what library was used, and the timestamp of the conversion. This level of transparency is impossible to achieve with standard manual entry.
Customizing expense reporting & adjustments
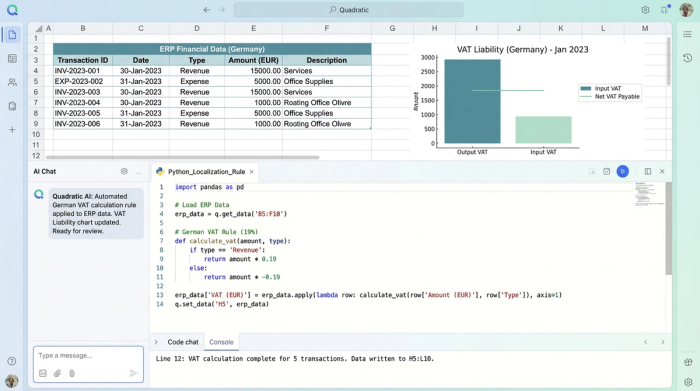
Beyond currency, financial localization requires handling regional nuances in tax laws and expense categorization. Different jurisdictions treat expenses like travel, meals, and entertainment differently for tax purposes. A standard spreadsheet requires the accountant to remember these rules and manually apply them row by row.
Quadratic allows users to build a logic layer using Python functions. An accountant can write a script that applies conditional logic to the data. For instance, a function could state: If Region == 'HK', apply 50% deduction rule to Meal_Expenses. This ensures that the rule is applied consistently across thousands of rows of data instantly.
Crucially, this logic does not come at the expense of presentation. While data scientists often use notebooks that are difficult to format for non-technical stakeholders, Quadratic maintains the grid structure of a spreadsheet. This allows for pixel-perfect, client-ready reports. Local financial advisors near me—the clients searching for expertise—expect professional, clean, and compliant outputs. Quadratic delivers the power of code without sacrificing the presentation standards required for formal financial statements.
Ensuring compliance and trust
The ultimate goal of financial reporting is trust. Auditors need to trust the process, and clients need to trust the outcome. In traditional spreadsheets, logic is often opaque. In Quadratic, the logic is visible. The code acts as a living documentation of the financial methodology used.
This adherence to general accounting principles through code ensures consistency. Once the logic for a specific region is defined, it can be reused across future reports, eliminating the risk of an accountant applying a rule differently from one month to the next.
This operational excellence feeds back into the firm's reputation. While financial advisor local SEO drives traffic to a website, the trust built through error-free, compliant reporting is what converts that traffic into long-term partnerships. Clients stay with advisors who demonstrate a mastery of their financial reality, down to the decimal point.
A real-world example: multi-region consolidation
To visualize this in practice, consider an accountant responsible for consolidating a US headquarters report with a Hong Kong branch. The workflow in Quadratic streamlines what used to be a multi-day process, leveraging the power of Python and SQL.
First, the accountant ingests raw financial data from both regions using SQL connectors. Next, they use a Python script to automate the currency conversion from USD to HKD, pulling historical rates for the exact reporting dates. Following this, they apply local tax adjustments via Python scripts, ensuring that Hong Kong specific tax rules are applied only to the relevant data subsets.
Finally, the output is generated. Whether you are analyzing the Hong Kong local financial app ranking or preparing a private ledger, data accuracy is paramount. The accountant can export the final, formatted report to a PDF that is ready for the client or auditor. The result is a compliant, localized financial statement produced in a fraction of the time, with a complete digital audit trail backing every figure.
Financial localization requires tools that are as dynamic as the global market. The era of relying on static, error-prone spreadsheets for complex compliance work is ending. By embracing programmable logic, accountants and local financial advisors can ensure their reporting is accurate, compliant, and scalable. It is time to move beyond manual entry and master local compliance through the power of automation.
Use Quadratic to master financial localization
- Automate complex financial reporting logic for GAAP/IFRS, tax rules, and regional nuances with Python for built-in compliance.
- Connect directly to live ERPs and databases using SQL to pull real-time data, eliminating manual exports and potential errors.
- Perform multi-currency conversions automatically with Python, fetching live exchange rates for specific dates and creating clear audit trails.
- Apply regional tax and expense adjustments consistently across thousands of rows using programmable logic.
- Maintain a transparent, auditable record of all calculations and adjustments directly within the familiar spreadsheet grid.
- Consolidate multi-region financial statements rapidly into pixel-perfect, client-ready reports.
Ready to streamline your financial reporting and ensure global compliance? Try Quadratic.