
A savings product that looks profitable at today’s interest rates might bleed money if the Fed cuts rates by 50 basis points tomorrow. This is the reality of product management in fintech and banking. You build a model based on current assumptions, but the moment you save the file, those assumptions begin to stale.
The problem with a traditional financial stress test model built in a standard spreadsheet is that it is static. It relies on hard-coded inputs for interest rates, growth, and churn. To test a new economic scenario, you have to manually update cells, break links, and hope you didn't overwrite a hard-coded value that was supposed to be a formula.
To truly understand product viability, you need a "living stress test." This involves building a financial projection that updates dynamically with market conditions. In this guide, we will walk through a real-world use case: building a 24-month projection for a high-yield savings product using Quadratic. We will cover how to set up a baseline using Python, integrate live Federal Reserve data, and analyze specific stress scenarios—such as fee cliffs and deposit fluctuation—to ensure your product remains in the black.
What is financial stress testing in product modeling?
Before diving into the build, it is important to distinguish between regulatory compliance and product viability. When most people hear the term, they think of credit stress testing for financial institutions, such as the Dodd-Frank Act Stress Test (DFAST) or CCAR. These are massive, regulatory requirements designed to ensure a bank has enough capital to survive a severe recession.
For product managers and FP&A professionals, a financial stress test has a different, more immediate scope. It is defined as modeling the breaking points of a specific product line under varying economic conditions. It asks specific questions: If the Fed Funds Rate drops to 3%, does our margin cover the platform fees? If average deposit sizes drop from $15k to $8k, do we still break even within 12 months?
This type of testing isn't just about regulatory safety; it is about commercial survival. It ensures that the unit economics of a savings account or credit product work in the real world, not just in a "best case" Excel template.
Step 1: Building the 24-month baseline model
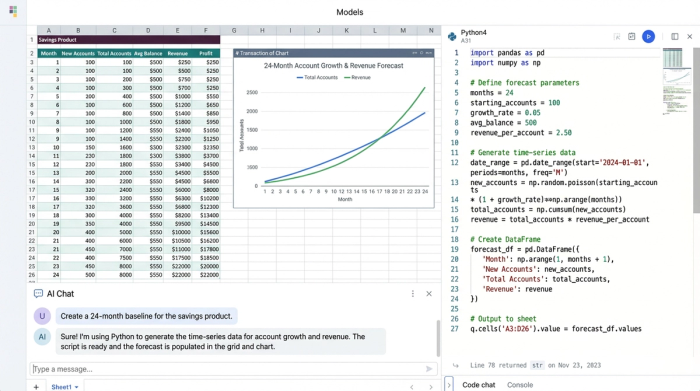
The foundation of any stress test is a clean, logical baseline, adhering to established financial modeling best practices. In a traditional spreadsheet, you might start by dragging formulas across 24 columns to represent two years of data. In Quadratic, we can keep the grid cleaner and the logic more robust by using Python to generate time-series data.
For this savings product use case, we start by defining our inputs in a dedicated section of the sheet:
- Base average balance (e.g., $10,000)
- Interest margins
- Projected account growth (month-over-month)
- Fixed and variable fees
Using Quadratic’s Python editor, we can reference these cells as variables. Instead of writing a formula in cell B2 and dragging it to Z2, we write a short Python script that calculates the monthly account growth for the entire 24-month period and outputs the array directly into the row. This makes the financial stress testing process much less prone to error; if you need to change the growth logic, you update the code in one place, and the entire timeline updates instantly.
This baseline provides the structure for the P&L, calculating gross interest income and interest expense based on the static inputs. However, a static model is not enough to survive volatility.
Step 2: Integrating live data (the "stress" variable)
The biggest gap in a standard financial stress test calculator is the reliance on manual data entry, a challenge best addressed by financial data analytics. If you want to see how your product performs against the current cost of funds, you usually have to look up the Fed Funds Rate, type it into a cell, and hope it hasn't changed by the time you present to the board.
Quadratic allows you to bridge this gap by pulling live data directly into the spreadsheet. For this model, we can use a built-in integration or a simple Python request to fetch the live Effective Federal Funds Rate (EFFR) from the Federal Reserve’s data API.
Once this data is in the sheet, it becomes a dynamic variable. We map the "Interest Expense" row in our 24-month model to this live rate. Now, every time the model runs, it calculates profitability based on the actual market reality, not a number hard-coded three months ago. This transforms the file from a static snapshot into a dynamic financial stress test model that reacts to the external economic environment automatically.
Step 3: Scenario analysis and sensitivity
With a live baseline established, we can now stress test specific vulnerabilities in the product's business model. A recent user utilized Quadratic to solve for three specific variables that were difficult to visualize in standard spreadsheets.
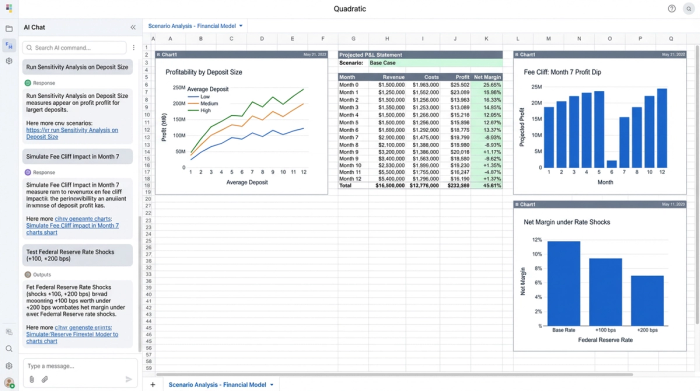
Deposit size sensitivity
Averages can be misleading. A product might look profitable with an average balance of $15,000, but what if the user base shifts and the average drops to $5,000? We can set up a sensitivity analysis that runs the P&L logic across different deposit tiers ($10k vs. $100k). By using Python to loop through these tiers, the user was able to identify the exact deposit floor required to maintain positive margins.
The "month 7" cliff
This specific use case involved a unique cost structure: the platform fees for the savings product increased significantly starting in the seventh month of a customer's lifecycle. In a standard spreadsheet, modeling this requires complex nested IF statements across every column (e.g., =IF(Month>=7, HighFee, LowFee)).
In Quadratic, the user handled this logically within the Python code block. They defined a condition where costs stepped up at index 7 of the time series. This allowed them to clearly visualize the "cliff"—the exact moment profitability dips. This granular level of financial stress test analysis revealed whether the initial six months of revenue were sufficient to buffer the higher costs later on.
Fed rate viability
Finally, the model tested the margin squeeze by assessing interest rate sensitivity. By creating a scenario where the live Fed Rate drops by 50 or 100 basis points, the user could see if the product remained viable. Because the model was built with Python variables, running this scenario didn't require rebuilding the sheet—it only required changing one "Shock Variable" input to see the ripple effect across the entire P&L.
Step 4: Visualizing breakeven and profitability
Data tables are useful, but they don't tell the story at a glance. The final step in this workflow is visualizing the outcomes to create a clear narrative for stakeholders.
The user focused on three key metrics:
1. Months to breakeven: How long until the product pays for itself?
2. Total profit: The cumulative net income over 24 months.
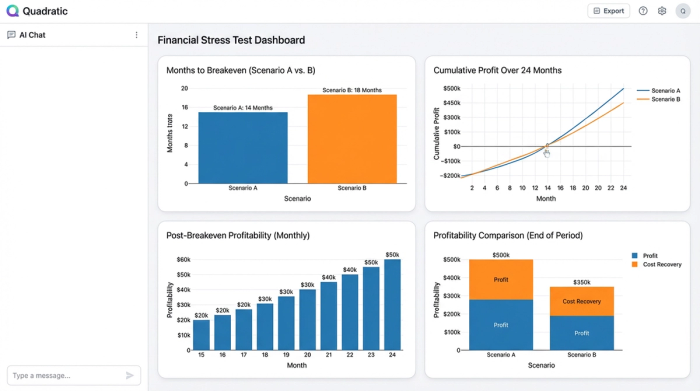
3. Average profit post-breakeven: The run-rate profitability once initial acquisition costs are recovered.
Using Quadratic’s charting capabilities, these metrics were visualized directly next to the data. Conditional formatting was applied to the P&L rows to highlight the "Month 7" cliff and the breakeven month in green or red. This turns the analysis into a visual handbook of financial stress testing for the internal team—a dashboard that anyone can look at to understand the product's health immediately.
Summary of the model
By moving this workflow into Quadratic, the user achieved a level of depth and automation for product profitability analysis that static spreadsheets could not provide.
- Real-time sensitivity: The model automatically adjusts interest expenses based on live Fed data.
- Granular fee analysis: Complex logic, like the Month 7 fee hike, is handled programmatically rather than with fragile formulas.
- Dynamic P&L projections: Changing a single input (like deposit size) instantly recalculates the entire 24-month outlook.
Conclusion
Traditional spreadsheets often struggle with the complexity required for multi-variable stress testing, a challenge that can be overcome with techniques like monte carlo simulation. They force analysts to choose between accuracy and maintainability, often resulting in static files that become obsolete the moment they are finished.
By using Quadratic, you can move from a static financial stress test to a dynamic profitability engine. You can combine the flexibility of a spreadsheet with the power of Python to ingest live data, model complex logic like fee cliffs, and visualize the results instantly. This ensures that your product strategy is built on reality, not just a best guess.
Use Quadratic to build dynamic financial stress tests
- Replace static spreadsheets with dynamic models that automatically update with live market data.
- Integrate real-time federal reserve data directly into your projections for accurate interest expense calculations.
- Model complex product cost structures and fee cliffs programmatically with python, avoiding fragile
ifstatements. - Run multi-variable sensitivity analyses on deposit sizes or interest rate shocks, instantly seeing the impact across your 24-month outlook.
- Visualize breakeven points and profitability with integrated charts and conditional formatting for clear stakeholder communication.
Ready to build dynamic financial stress tests that adapt to market changes? Try Quadratic.