Scaling an e-commerce brand is a balancing act. You might be hitting record revenue numbers, but if your margins are being erased by inefficient ad spend, that top-line growth is hollow. For digital marketing analysts and PPC managers, the pressure isn't just to spend the budget—it is to spend it with efficient PPC management.
Managing advertising cost of sales is not a "set it and forget it" task. It requires daily hygiene, granular analysis, and the ability to pivot immediately when a campaign starts bleeding money. However, most marketers struggle to bridge the gap between raw data exports—often messy CSVs from platforms like Amazon Ads—and actionable decisions. They spend hours formatting spreadsheets rather than analyzing strategy.
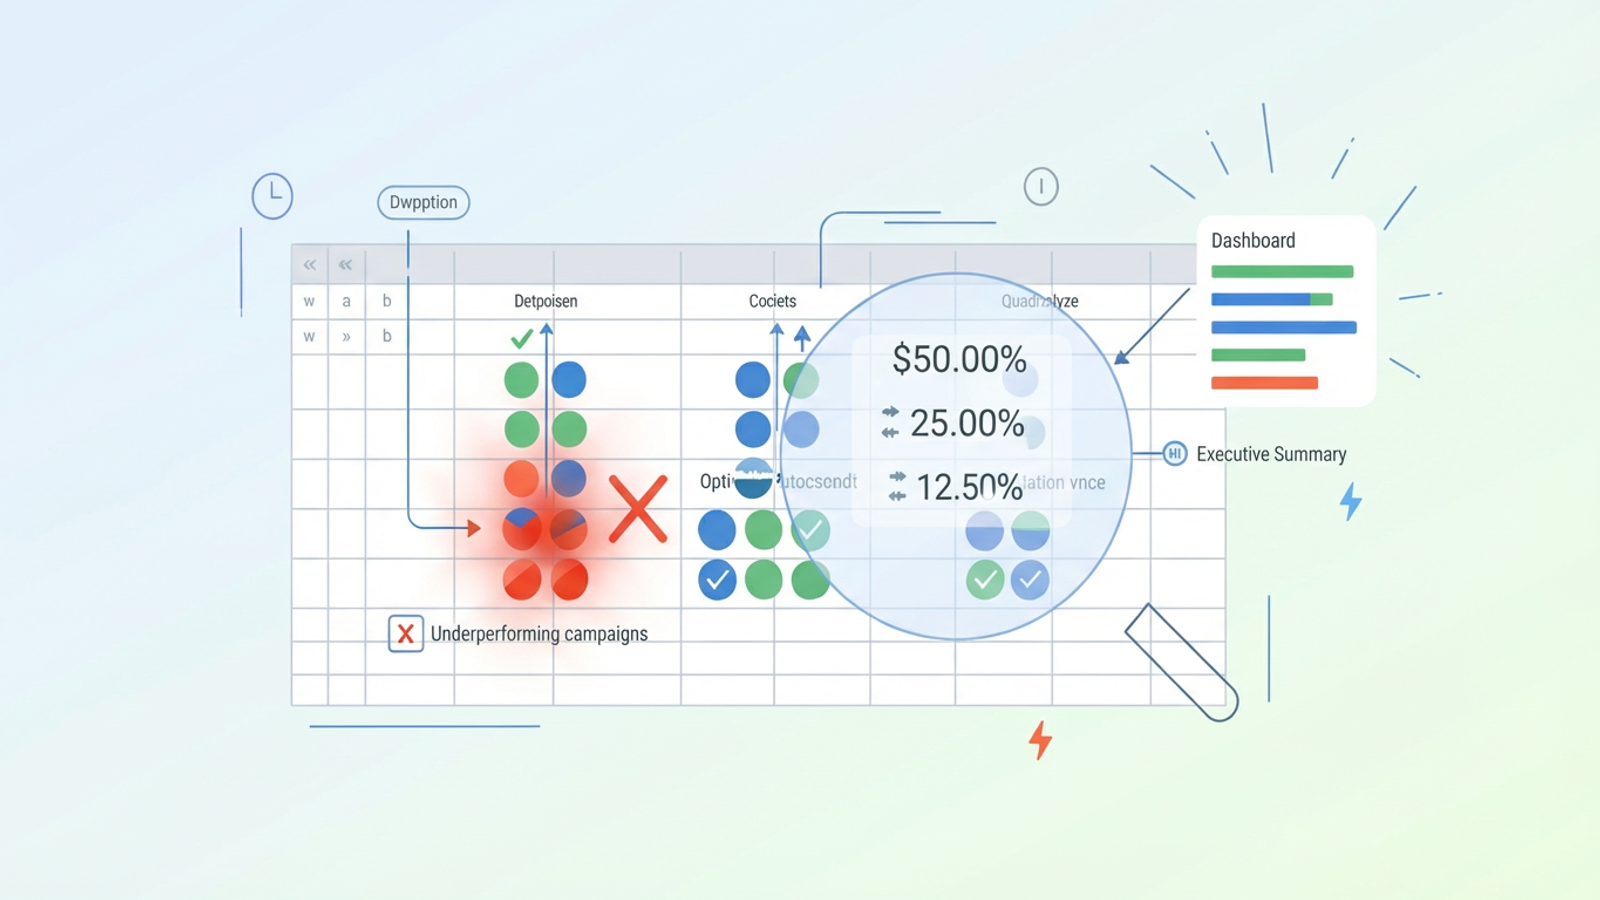
To truly reduce ACoS, you need a workflow that automates data cleaning and highlights immediate corrective actions. You need to turn raw numbers into "Stop" or "Go" signals. This article explores how to move from reactive reporting to building a proactive optimization engine using Quadratic.
What is advertising cost of sales (ACoS)?
Before diving into the technical workflow, it is important to define the metrics that guide these decisions. At its core, advertising cost of sales is a metric of efficiency. It tells you exactly how much you are spending on advertising for every dollar of revenue generated from those advertisements.
The advertising cost of sales formula
The math is straightforward, but the implications are significant for your bottom line. To calculate this metric, you use the advertising cost of sales formula:
(Ad Spend / Ad Revenue) * 100
For example, if you spend $20 on ads to generate $100 in sales, your ACoS is 20%. Understanding what is ACoS advertising cost of sales allows you to set a break-even point. If your product margin is 30%, an ACoS of 20% means you are profitable. If it creeps up to 31%, you are losing money on every sale.
ACoS vs. TACoS (Total Advertising Cost of Sales)
While ACoS measures the efficiency of the ads themselves, it doesn't paint the full picture of your brand's health. This is where total advertising cost of sales (TACoS) comes in. TACoS measures advertising spend relative to total revenue (organic + paid).
(Ad Spend / Total Revenue) * 100
TACoS helps you understand if your ads are driving organic growth or cannibalizing it. However, while TACoS is a long-term strategic metric, daily ACoS optimization is the tactical lever you pull to improve profitability right now.
The challenge of granular daily analysis
Knowing the formulas is the easy part. The real challenge lies in the volume and velocity of data. A typical PPC manager might be juggling hundreds of campaigns, thousands of keywords, and multiple targeting types.
Standard data exports from ad platforms are notoriously messy. You are often confronted with CSV files cluttered with formatting issues—currency columns with four decimal places, string formats that don't behave like numbers, and inconsistent date fields.
This "messy data" barrier, which often presents common data cleaning challenges, slows down decision-making. When you are trying to scan rows of data to find inefficiencies, cognitive load matters. Looking at a figure like "$12.4392" takes longer to process than a clean "$12". To make fast decisions, analysts need a system that converts raw noise into specific, clean integer money figures and precise two-decimal percentages for rates like CTR (Click-Through Rate) and CVR (Conversion Rate).
Building a daily ACoS optimization engine in Quadratic
To solve the data volume and formatting issues, you need an environment where you can manipulate data programmatically without losing the visual context of a spreadsheet. Quadratic allows you to combine the familiarity of a grid with the power of Python and SQL, creating a robust engine for daily optimization.
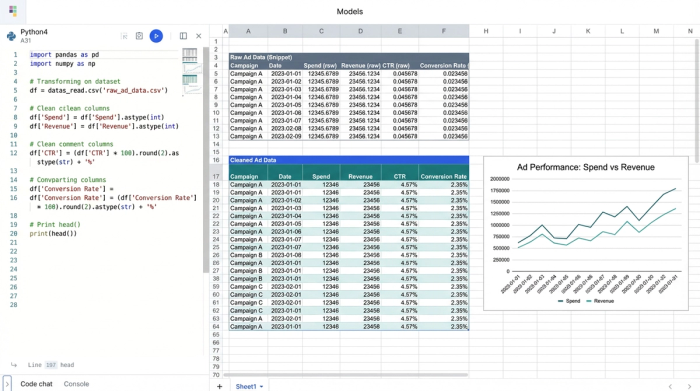
Step 1: Ingesting and cleaning raw data
The first step in the workflow is importing the raw daily performance data, potentially through a Meta Ads API for enhanced automation. In a traditional spreadsheet, you might spend the first 20 minutes of your day finding and replacing currency symbols or fixing decimal points.
In Quadratic, you can use Python to automate this hygiene. By writing a simple script to ingest the CSV, you can instantly transform the data into your preferred format. You can strip away unnecessary decimal points from spend and sales columns to display clean integers, making the financial data strictly "dollars and cents" or even rounded whole numbers for quick scanning. Simultaneously, you can format your efficiency metrics (CTR, CVR, ACoS) into strict two-decimal percentages. This ensures that when you look at the grid, you are seeing standardized, readable data every single time.
Step 2: Aggregating by portfolio and match type
Optimization strategies often fail because users look at averages. A campaign might have an acceptable 25% ACoS overall, but that average could be hiding a disaster.
Using SQL queries directly within Quadratic, you can query your cleaned data to group metrics by Portfolio, Match Type, and Targeting Type, which are key customer segmentation strategies. This level of aggregation is critical for advertising cost of sales Amazon strategies. You might discover that while your "Broad Match" keywords are efficient, "Exact Match" targeting on a specific portfolio is bleeding budget with no return.
By running a SQL query like SELECT Portfolio, MatchType, SUM(Spend), SUM(Sales) FROM AdData GROUP BY Portfolio, MatchType, you can instantly visualize which specific segments are dragging down your performance, rather than guessing based on campaign-level averages.
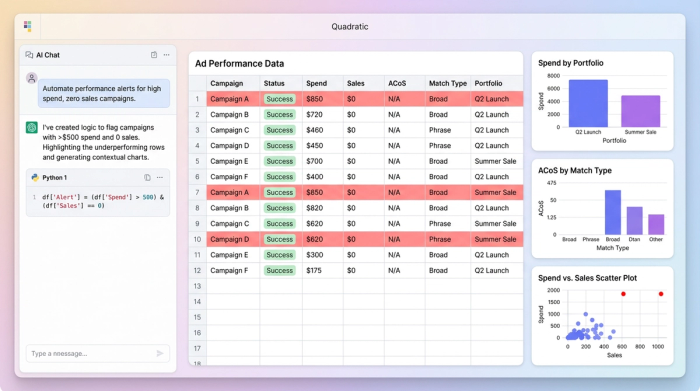
Step 3: Automating performance alerts
The final step in the engine is moving from analysis to action. You shouldn't have to hunt for errors; the system should flag them for you.
Using Python or SQL, you can build logic-based alerts into your Quadratic sheet. For example, you can set a rule that highlights any row where Spend > $50 and Sales = 0. These flags serve as immediate "Stop" signals. Instead of analyzing every row, the report directs you to the specific keywords that need to be paused or bids that need to be reduced immediately. This turns the spreadsheet into a command center for corrective action.
Analyzing performance at the product & price point level
To further reduce waste, you must look beyond the ads and examine the products themselves. There is often a disconnect between ad performance and understanding unit economics. A high ACoS advertising cost of sales might not be a bidding problem; it might be a pricing problem.
In Quadratic, you can correlate your ad performance data with a separate dataset containing product models and price points. By joining these datasets, you can analyze profitability at the SKU level. You may find that a specific product model at a lower price point simply cannot support paid traffic, regardless of how much you optimize the keywords. This insight allows you to stop advertising that SKU entirely, instantly improving your overall account efficiency.
When you analyze advertising cost of sale metrics alongside price points, you shift from being a media buyer to a business strategist, ensuring that ad spend is only directed toward products with the margin to support it.
Creating the executive summary
Once the daily granular work is done and the fires are put out, you need to communicate the results. Stakeholders don't need to see the SQL queries or the thousand-row datasets; they need confidence that the budget is being managed effectively.
You can structure a top-level dashboard in Quadratic for effective marketing data visualization that aggregates your daily work into a clear executive summary. Key metrics to track include:
- Daily Spend vs. Sales trends.
- Portfolio-level ACoS performance over time.
- A log of action items executed (e.g., "5 Non-performing keywords paused," "3 Bids reduced").
This summary proves that the advertising cost of sales is being actively managed, not just monitored. It transforms technical data operations into a business narrative.
Conclusion
Reducing advertising cost of sales requires more than just lowering bids; it requires better data visibility and a streamlined workflow. When you are drowning in messy exports and formatting issues, you miss the critical signals that save money.
By moving away from rigid dashboards and manual spreadsheet formatting, you can regain control of your data. Using Quadratic to build a custom, code-powered analysis engine allows you to clean data automatically, aggregate it intelligently, and turn raw numbers into profit-saving decisions.
Use Quadratic to reduce advertising cost of sales
- Automatically clean and standardize messy ad platform data, transforming raw numbers into clear financial figures and precise percentages for ACoS, CTR, and CVR.
- Use Python and SQL directly in the spreadsheet to aggregate performance by portfolio, match type, and targeting type, quickly identifying underperforming segments.
- Build automated alerts to flag inefficient ad spend (e.g., high spend with zero sales), turning raw data into immediate "stop" or "go" signals.
- Correlate ad performance with product-level data to analyze profitability by SKU and price point, ensuring ad spend supports healthy margins.
- Create clear executive summaries and dashboards that transform daily granular optimizations into actionable insights for stakeholders, proving effective budget management.
Ready to optimize your ad spend? It's easy to get started. Try Quadratic.