
Table of contents
- Why standard inventory spreadsheets fail multi-partner businesses
- Building the ultimate reseller inventory tracker in Quadratic
- Visualizing business health: sales duration & profit margins
- Automating monthly financial reports
- The advantage of a code-powered workflow
- Conclusion & next steps
- Use Quadratic to build an automated reseller inventory tracker
Growing a resale business is exciting. Sourcing inventory, finding hidden gems, and making the sale provides a rush that keeps the business moving. However, as you scale from a solo flipper to a business manager dealing with multiple partners, consignment deals, and hundreds of SKUs, the administrative side can quickly become a bottleneck. Tracking variable costs, managing different commission rates for partners, and calculating monthly net profits often leads to "spreadsheet fatigue."
Most business owners start with a simple spreadsheet. But as inventory grows, standard spreadsheets break. Formulas get accidentally deleted, manual copy-pasting leads to accounting errors, and basic grids fail to show the real health of your business, such as how long capital is tied up in unsold stock.
The solution isn't necessarily buying expensive, rigid Enterprise Resource Planning (ERP) software. Instead, you can build a code-powered reseller inventory tracker inside Quadratic. By combining the familiarity of a spreadsheet with the power of Python and SQL, you can create a flexible tool that automates complex partner splits, visualizes sales duration, and handles your monthly reporting instantly.
Why standard inventory spreadsheets fail multi-partner businesses
If you search for inventory templates, you will find thousands of static Excel or Google Sheets files. These work well for a hobbyist selling a few items a month on eBay. However, for a serious reseller managing typical consignment arrangements or partnerships, these static templates create more problems than they solve.
The primary issue is the rigidity of standard formulas. In a multi-partner setup, you might have different consignment agreement terms with different suppliers. Partner A might get a 50% split of the net profit, while Partner B gets 70% of the gross sale price minus shipping. Trying to manage these variable logic rules with nested IF statements in a standard spreadsheet is a recipe for disaster. One broken cell reference can skew your entire month's payout data.
Furthermore, standard grids are terrible at visualizing time. A row of data can tell you an item is "unsold," but it rarely highlights that the item has been sitting in a warehouse for 180 days, tying up cash flow. Finally, the end-of-month reporting process usually involves a "copy-paste nightmare," where you manually aggregate data from different tabs to create financial reports for each partner. This manual process is slow, unscalable, and prone to human error.
Quadratic offers a middle ground. It allows you to maintain the flexibility of a spreadsheet interface—where you can easily add columns or change data—while using Python and SQL to handle the heavy lifting of logic, data querying, and visualization.
Building the ultimate reseller inventory tracker in Quadratic
To move away from fragile templates, you can replicate the workflow of successful high-volume resellers who have adopted Quadratic. The goal is to build a tracker that acts less like a static list and more like an application tailored to your business rules.
Centralizing data with SQL
In a traditional spreadsheet, you might have separate tabs for "Expenses," "Active Inventory," and "Sold Items." To get a clear picture of your finances, you often have to use fragile VLOOKUP or INDEX/MATCH formulas to pull cost data into your sales tab.
In Quadratic, you can treat your data tables like a database. You can organize your costs, revenues, and supplier details into structured tables and then use SQL to query this data instantly. Instead of writing a complex formula to find a product's cost, you can write a simple SQL query directly in the sheet to join your "Sales" table with your "Acquisitions" table. This ensures that your data remains consistent and that you are always looking at the most up-to-date information without dragging formulas down a thousand rows.
Automating partner splits with Python
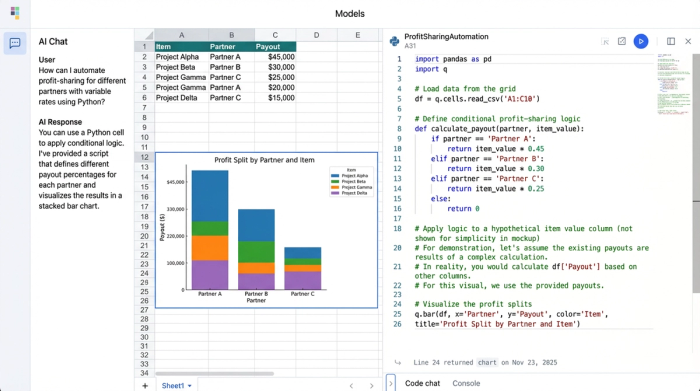
The most powerful aspect of a code-powered reseller inventory tracker is the ability to automate profit splits using Python. In a standard sheet, calculating payouts for five different partners with five different commission structures requires massive, unreadable formulas.
In Quadratic, you can use Python directly in the grid. You can write a short script that references your sales data and applies logic based on the "Partner" column. For example, your script can iterate through the rows and apply specific rules:
- If the partner is "Alice," deduct shipping, then split net profit 50/50.
- If the partner is "Bob," pay out 30% of the gross sale price immediately.
- If the item is "House Inventory," keep 100% of the profit.
Because this is written in code, it is robust. Adding a new row doesn't break the logic, and you can easily update the rules in one place (the code cell) rather than updating thousands of formula cells. This transforms your spreadsheet from a passive record-keeper into an active engine that calculates your liabilities automatically.
Visualizing business health: sales duration & profit margins
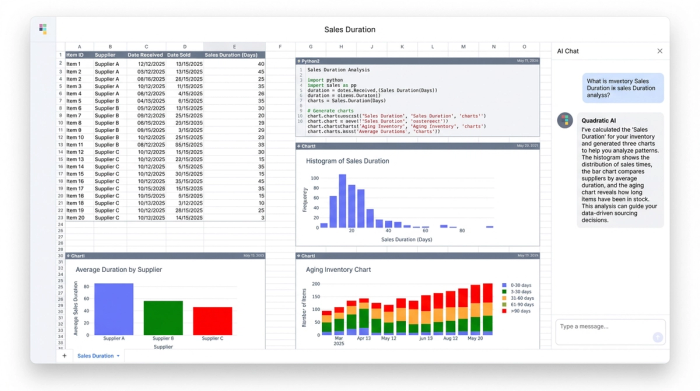
A list of numbers can tell you what sold, but it struggles to tell you how your business is performing over time. One of the critical metrics for resellers is "Sales Duration" or "Inventory Holding Period," also known as "Time-to-Sell." Knowing that you made $50 profit is good; knowing it took 120 days to make that $50 is vital information that might change your sourcing strategy.
Tracking sales duration
Using Python in Quadratic, you can calculate the days between "Purchase Date" and "Sale Date" for every item instantly. While you can do this with simple subtraction in a normal spreadsheet, Quadratic allows you to take it a step further by visualizing this data programmatically.
You can create a histogram or a timeline chart directly in the spreadsheet that groups your sales by duration. This visualization might reveal that inventory from Supplier A typically sells within two weeks, while inventory from Supplier B sits for an average of four months. This insight allows you to make data-driven decisions about which partners to prioritize and which items to discount to clear space.
Interactive charts
Unlike static pie charts that often clutter standard dashboards, the charts in Quadratic can be dynamic. You can set up your Python code to filter data based on specific criteria—such as category, partner, or date range—and the charts will update automatically.
For a reseller, this means you can have a "[Dashboard" section at the top of your tracker. As you enter new sales data at the bottom of the sheet, your profit margin graphs and sales velocity charts update in real-time. This provides an immediate feedback loop, allowing you to see how today's sales impact your overall monthly goals without needing to refresh a pivot table or rebuild a chart.
Automating monthly financial reports
The most dreaded time for any multi-partner resale business is the first of the month, though understanding the benefits of automating financial reports can alleviate this. This is when you must reconcile accounts, calculate what is owed to consignors, and determine your own net profit. In a manual workflow, this involves filtering rows, copying data to new sheets, formatting PDFs, and double-checking math.
Aggregate vs. partner-level reporting
A robust reseller inventory tracker built in Quadratic handles this automatically. You can set up a "Reporting" area in your spreadsheet that generates two distinct views simultaneously:
1. Master View: This shows the total business performance. It aggregates total revenue, total costs (shipping, fees, cleaning), and total payouts due to partners to show your actual business net income.
2. Partner Views: Using Python, you can generate individual payout tables for each partner. The code can filter the master dataset for "Partner = Alice" and "Status = Sold" and "Paid = False," generating a clean, formatted table showing exactly what items sold and what the payout is.
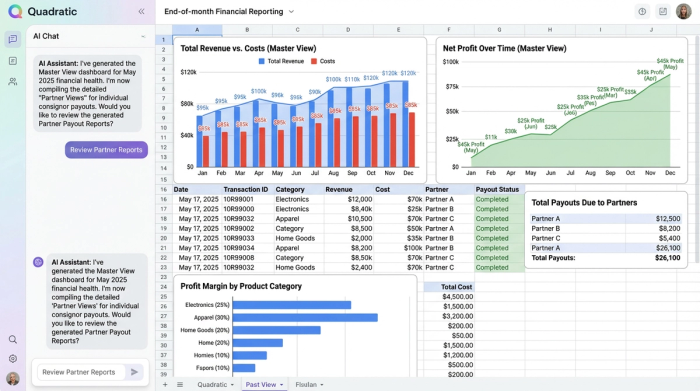
This turns a multi-hour accounting task into a near-instant refresh. When the month ends, you simply check your data, run your Python cells, and your financial reports are ready. You can even export these tables to PDF or CSV to email directly to your partners, ensuring transparency and accuracy without the manual labor.
The advantage of a code-powered workflow
Adopting a tool like Quadratic for your inventory management bridges the gap between the "wild west" of Excel templates and the rigid, expensive structure of dedicated inventory SaaS apps.
The primary advantage is flexibility. Because Quadratic is still a spreadsheet at its core, you aren't locked into the fields a software developer decided you need. If you want to start tracking "Source Location" or "Item Weight," you simply add a column. You don't need to wait for a feature update.
The second advantage is power. By offloading the calculations to Python and SQL, your tracker can handle thousands of items and complex commission logic without crashing or slowing down. You eliminate the risk of "fat-finger" errors breaking a complex formula chain because the logic is centralized in code.
Finally, there is the efficiency of automation. You get the benefits of a custom-built software application—automated reporting, dynamic dashboards, and strict data logic—without the high monthly per-user fees or the learning curve of a new enterprise system. You are building a tool that fits your business, rather than forcing your business to fit a tool.
Conclusion & next steps
You do not need to be a software developer to leverage the power of Python and SQL in your business. However, if you are managing a multi-partner resale operation, you do need tools that are more robust than a static .xlsx file. As your inventory scales, the administrative burden of tracking splits, costs, and timelines can eat into the profits you work so hard to generate.
By building a custom reseller inventory tracker in Quadratic, you gain visibility into your sales duration, automate your partner payouts, and reclaim the hours previously lost to manual monthly reporting. It allows you to focus less on the spreadsheet and more on sourcing the next great find.
Start building your automated reseller inventory tracker in Quadratic today and turn your data into your competitive advantage.
Use Quadratic to build an automated reseller inventory tracker
- Automate variable partner profit splits (e.g., 50% net, 70% gross) with robust Python logic, replacing fragile nested formulas.
- Track sales duration and inventory holding periods instantly to identify slow-moving stock and optimize sourcing strategies.
- Centralize inventory, cost, and sales data using SQL queries, ensuring consistent, accurate financial reporting without VLOOKUP nightmares.
- Generate real-time, dynamic charts and dashboards that update automatically, providing immediate insights into profit margins and sales velocity.
- Automate monthly financial reports, creating both aggregate business overviews and individualized partner payout statements in moments.
Start building your automated reseller inventory tracker in Quadratic today. Try Quadratic