
Table of contents
The integration of technology in sports has shifted from a luxury for elite clubs to a standard requirement for competitive teams at all levels. Whether you are managing a professional squad or a high-level academy, the use of a soccer performance tracker has become ubiquitous. These devices, leveraging GPS-based player tracking, provide an objective lens on the game, stripping away biases and offering hard numbers on physical output.
However, a hardware problem often leads to a data problem. A GPS performance tracker soccer vest is excellent at collecting thousands of data points—including GPS metrics that help us understand external load like sprints, total distance, top speed, and impacts—but it cannot inherently tell you who had a good game. Analysts and coaches often find themselves drowning in raw CSV exports, staring at rows of numbers that lack context.
The solution lies in the analyst’s most versatile tool: the spreadsheet. By applying specific logical and aggregation functions, you can transform a static wall of numbers into a dynamic report. In this guide, we will walk through a complete workflow using Quadratic to process raw sports data, turning hardware metrics into actionable coaching insights.
Setting up your analysis dashboard
Before diving into formulas, we need to establish the context of our data. For this walkthrough, imagine we have exported a session file from a system like Playmaker youth soccer performance tracking. The raw export typically arrives as a CSV file, which we can drop directly into Quadratic.
Unlike traditional spreadsheets that confine you to a rigid grid, importing this data into Quadratic provides an infinite canvas. This allows you to keep your raw data on one side and build your analysis dashboard adjacent to it without running out of space or breaking the visual flow.
Our dataset includes the following columns:
- Player Name: The identifier for the athlete.
- Distance (km): Total ground covered during the match.
- Top Speed (m/s): The maximum velocity reached.
- Goals Scored: Offensive output.
- Errors: Unforced turnovers or failed passes.
With the data loaded into the grid, we can move from simple observation to mathematical interrogation.
Conditional aggregations: quantifying team metrics
Before dissecting individual player performance, it is vital to establish a baseline for the team. This "Toolkit" approach helps an analyst understand the general physical load and output of the squad. To do this, we rely on conditional aggregations—specifically COUNTIF and SUMIF.
These functions allow us to ask questions of the data based on specific criteria. For example, a coach might want to know how many players are hitting high-volume physical targets to monitor for fatigue or overtraining.
Scenario 1: High volume runners
We want to count the number of players who covered more than 10 kilometers in the match, a threshold often aligned with the typical distance covered by a top-level outfield male player.
Formula: =COUNTIF(Distance_Column, ">10")
Scenario 2: Offensive efficiency by position
We want to sum the total goals scored specifically by the forwards to see if the attack is functioning as intended.
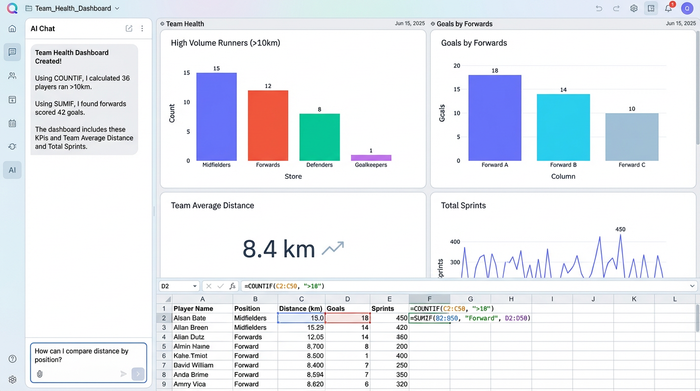
Formula: =SUMIF(Position_Column, "Forward", Goals_Column)
By setting up these formulas at the top of your Quadratic sheet, you create a "Team Health" snapshot that updates automatically whenever new data is pasted in.
Logical operations: automating performance grading
Once team metrics are established, the focus shifts to evaluating individuals. A performance tracker soccer device records the metrics, but it is the analyst's job to assign value to them. This is where we move from counting to evaluating using logical operations like IF, AND, and OR.
These functions allow you to create automated grading systems. Instead of manually reviewing every row to see who played well, you can create a "Match Rating" column that flags performances based on your specific tactical requirements.
Scenario: Creating an automated match rating
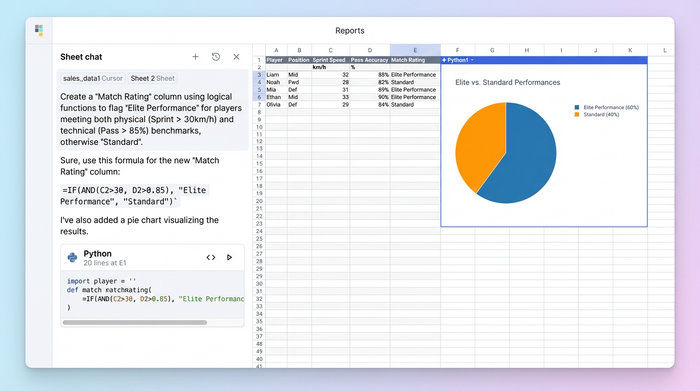
Let’s say we want to identify "Elite Performance" based on a combination of physical effort and technical success. We define "Elite" as a player who ran more than 9km AND had a pass completion rate higher than 80%.
We can combine IF and AND to build this logic:
Formula: =IF(AND(B2>9, C2>80), "Elite Performance", "Standard")
In this formula, B2 represents the distance and C2 represents pass completion. If both conditions are met, the cell displays "Elite Performance." If not, it defaults to "Standard." This instantly highlights key contributors without requiring you to scan every cell manually.
Data lookups: connecting stats to player profiles
A common challenge in sports analytics is that performance data is often siloed from biographical data. Your GPS export might have a Player ID or Name, but it rarely includes the player’s age, height, or primary position. To get a complete picture, you need to merge the match stats with your master roster database.
This is the evolution of lookups. While many analysts started with VLOOKUP, modern analysis favors XLOOKUP due to its durability—it doesn't break if you insert new columns, which is a frequent occurrence when working with evolving sports datasets.
Scenario: Merging roster details
You have a "Player ID" in your performance sheet and need to pull their "Position" from a separate roster sheet to perform the aggregation analysis mentioned earlier.
Formula: =XLOOKUP(A2, Roster_Sheet!A:A, Roster_Sheet!C:C)
In this example, A2 is the Player ID in your stats sheet, Roster_Sheet!A:A is the column of IDs in your roster, and Roster_Sheet!C:C is the position column you want to retrieve.
One of the distinct advantages of working in Quadratic for this workflow is the clarity of the formula syntax. In traditional tools, complex lookups can become difficult to read in a cramped formula bar. Quadratic renders these formulas clearly, making it easier to verify that you are referencing the correct datasets.
Why Quadratic is the modern sports analyst’s canvas
The workflow described above transforms raw numbers into a structured report, but the environment in which you do this work matters, making Quadratic one of the best data science tools for modern analysts. Quadratic offers a modern grid that aligns with the needs of contemporary sports analysts, functioning as a powerful coding spreadsheet.
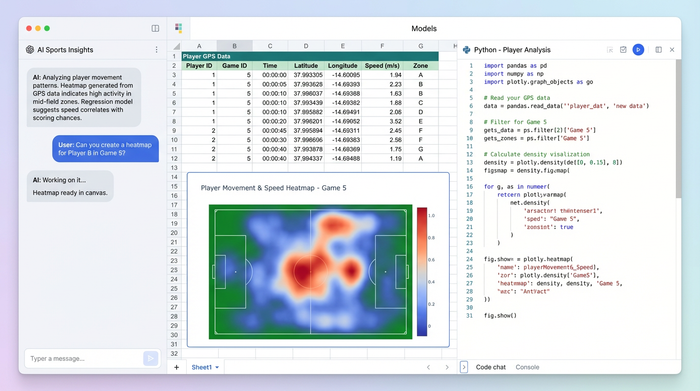
While this guide focused on essential spreadsheet formulas, the reality of sports data is that it is becoming increasingly complex. Quadratic allows you to go beyond formulas by incorporating Python directly into the grid, establishing itself as a powerful python spreadsheet. As your analysis grows more sophisticated—perhaps you want to visualize heatmaps from that GPS performance tracker soccer data or run regression models on injury prevention, engaging in advanced predictive modeling and analytics—you can do so in the same workspace without switching tools.
Furthermore, the clarity of Quadratic’s interface is critical when dealing with nested logic. Formulas like the IF(AND(...)) examples used earlier are powerful but can be prone to syntax errors. Quadratic makes reading, writing, and debugging these logical operations significantly more intuitive, ensuring your match reports are accurate before they reach the coach.
Conclusion
A soccer performance tracker is only as powerful as the analysis applied to it. The device collects the evidence, but the spreadsheet delivers the verdict. By mastering conditional aggregations, logical grading, and robust lookups, you can turn a chaotic CSV export into a clear, competitive advantage for your team.
We encourage you to export your latest match data and load it into Quadratic. Try applying these "Cheat Sheet" formulas today to see how quickly you can uncover insights that might otherwise remain hidden in the raw numbers.
Use Quadratic to analyze soccer performance
- Transform raw GPS performance tracker data into actionable coaching insights.
- Organize raw data and analysis dashboards side-by-side on an infinite canvas, eliminating rigid grid limitations.
- Automate team health snapshots and quantify player performance with conditional aggregations like
COUNTIFandSUMIF. - Instantly grade individual player efforts and technical success using logical operations such as
IF,AND, andOR. - Seamlessly merge performance stats with player profiles using robust
XLOOKUPfunctions that won't break your analysis. - Extend your analysis beyond formulas by incorporating native python directly into the spreadsheet for advanced modeling and visualizations.
Ready to turn your soccer performance data into a competitive advantage? Try Quadratic.