
Table of contents
- Why traditional spreadsheets struggle with annual aggregation
- The workflow: building a report that writes itself
- The result: an automated annual summary
- Quadratic vs. Power BI and Excel for education reporting
- Moving from "managing files" to "managing logic"
- Key takeaways for education administrators
- Conclusion
- Use Quadratic to build a student performance dashboard
For many education administrators and registrars, the end of the academic year brings a specific kind of anxiety. You have spent months meticulously tracking student data—enrollment figures, attendance records, financial contributions, and academic scores. But now, you face the task of consolidating twelve separate monthly sheets into one cohesive student performance dashboard.
In a standard workflow, this often marks the beginning of "spreadsheet fatigue." You open an Excel file, create eleven copies of your January template, manually rename tabs for every month, and hope that your complex formulas—like those calculating a specific 10-point grading scale—do not break when you move the data. It is a fragile process where a single copy-paste error can compromise the data integrity of the entire year's reporting.
There is a better way to handle this data. By shifting your approach from managing static files to managing logic, you can build a report that updates itself. This article explores how to automate the annual reporting cycle using Quadratic, turning a week of manual consolidation into a streamlined, automated workflow, aligning with the growing adoption of digital tools for education data collection.
Why traditional spreadsheets struggle with annual aggregation
The primary issue with building a student performance dashboard excel setup is the reliance on manual replication. In the use case of a school administrator, the "January" sheet is often a masterpiece of logic. It tracks student IDs, calculates financial contributions, and applies specific academic scoring rules. The problem arises when February arrives.
To continue the report, the administrator typically duplicates the January tab. This manual action introduces immediate risks. Cell references that pointed to a specific summary page might break or shift. If the administrator updates the grading logic in March, they must remember to go back and manually update January and February to match, or else the year-end data will be inconsistent.
Furthermore, traditional spreadsheets are static regarding time. When you create a new tab, you must type "February" into the header. The software does not inherently understand that February follows January or that the data should flow sequentially. This forces the user to act as the data processor, manually bridging the gap between months rather than letting the software handle the progression of time.
The workflow: building a report that writes itself
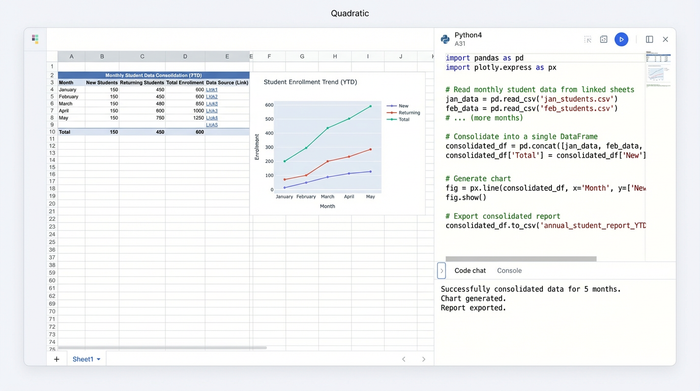
In Quadratic, the goal is to define the rules once and let the system handle the repetition. This approach was successfully used by an administrator who needed to track enrollment, attendance, and complex academic metrics across a full year without the risk of manual errors.
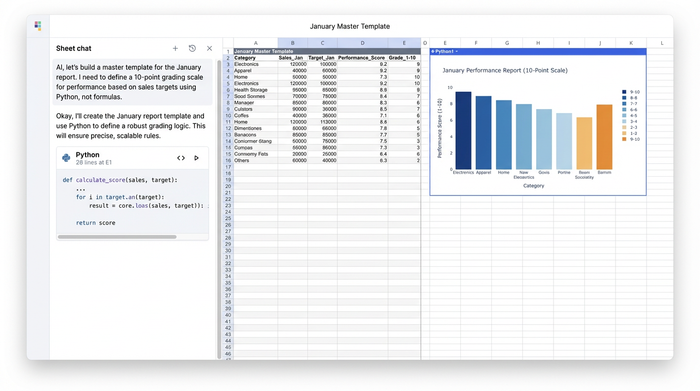
Step 1: perfecting the logic (the master template)
The process begins by building a single, perfect month. In this use case, the administrator set up the structure for January. This included columns for student names, attendance percentages, and a sophisticated formula to calculate academic scores based on a 10-point scale, aligning with established academic grading scales and principles. Because Quadratic allows for Python and SQL alongside standard formulas, this grading logic can be defined precisely. Instead of a fragile chain of nested "IF" statements, the logic is written clearly, ensuring that the 10-point scale is applied consistently to every student.
Step 2: automating the 11-month replication
Once the master template is defined, the traditional workflow would require copying that tab eleven times. In Quadratic, the administrator used the system's ability to replicate structure programmatically. By treating the spreadsheet structure as code, they generated the remaining eleven months instantly. This ensures that the structure of "December" is mathematically identical to "January." There is no risk of a column shifting by one pixel or a formula breaking because a cell range was dragged incorrectly.
Step 3: dynamic date adjustment
A key feature in this workflow is treating time as data. In a standard spreadsheet, headers are just text. In this automated workflow, the dashboard is aware of the date sequence. When the additional months are generated, the system automatically adjusts the headers—incrementing January to February, February to March, and so on. The administrator does not need to type a single date manually. This dynamic adjustment ensures that if the reporting period changes (for example, shifting from a calendar year to a fiscal year), the entire dashboard updates its timeline automatically.
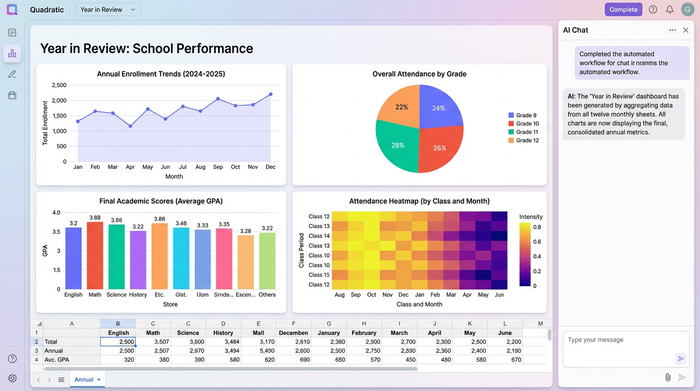
The result: an automated annual summary
The ultimate goal of this workflow is the creation of a "Year in Review" view. In the manual process, creating an annual summary involves linking cells from twelve different tabs, a process that is tedious and prone to reference errors.
With the automated approach, the administrator created a separate Annual Summary view that aggregates totals and averages from the generated monthly sheets. Because the months were created using a consistent logic, the summary view can pull data with absolute precision. The most powerful aspect of this setup is the live connection between the months and the year-end report. If an administrator corrects a student's attendance record in the "March" sheet, the Annual Summary updates instantly. There is no need to re-run reports or re-consolidate tables; the data flows seamlessly from the daily entry to the annual overview.
Quadratic vs. Power BI and Excel for education reporting
When looking for tools to solve this problem, administrators often feel stuck between two extremes: the manual labor of Excel and the technical complexity of business intelligence tools.
A student performance dashboard power bi solution is undeniably powerful. It can handle massive datasets and create beautiful visualizations. However, for a registrar or operations manager, it is often overkill. Setting it up requires connecting to external databases, understanding data modeling, and navigating a steep learning curve. It lacks the flexibility of a spreadsheet where you can simply type in a new student's name or adjust a grade on the fly.
On the other hand, the manual Excel method is familiar but dangerous for data integrity. As discussed, the risk of broken formulas increases with every new tab added, underscoring the need for robust data management best practices.
Quadratic offers a middle ground. It provides the familiar grid interface where you can edit data directly, but it backs it with the power of Python and SQL. This allows for the kind of data integrity usually found in complex systems—similar to what you might expect from a uwsom student performance dashboard or a uw student performance dashboard at a major research institution—without requiring a dedicated IT team to build it. You get the flexibility of a spreadsheet with the automation capabilities of a database.
Moving from "managing files" to "managing logic"
The shift from manual reporting to automated dashboards represents a change in strategy. In the old workflow, the administrator manages files—tabs, rows, columns, and cell borders. They spend their time checking if the formatting on page 5 matches page 1.
In the Quadratic workflow, the administrator manages rules. They define the 10-point grading scale and the attendance thresholds once. The software then applies those rules across the entire year. This shift allows education professionals to stop acting as data entry clerks and start acting as analysts. A reporting task that used to take three days of copying and pasting can now be reduced to a 30-minute review of the final figures.
Key takeaways for education administrators
- Consistency: Every monthly sheet is structurally identical, eliminating formatting errors and broken references.
- Accuracy: Complex logic, such as grading scales, is defined in one place and applied everywhere, ensuring every student is evaluated by the exact same criteria.
- Speed: The Annual Report is not a separate project; it is a live view that is ready the moment the final data is entered.
Conclusion
Student performance reporting is critical for tracking progress and ensuring institutional success, but it should not be a manual burden that consumes weeks of administrative time. By moving away from static spreadsheets and embracing a tool that automates the replication of logic, you can reclaim your time and trust your data.
If you are tired of the end-of-year copy-paste cycle, try Quadratic for your next annual report. Experience the difference of a student performance dashboard that works for you, ensuring your focus remains on education rather than data consolidation.
Use Quadratic to build a student performance dashboard
- Automate annual report creation: Instantly replicate your perfect monthly template across all 12 months, ensuring structural consistency and eliminating manual copy-paste errors.
- Implement complex grading logic flawlessly: Define sophisticated 10-point grading scales or attendance calculations once with Python/SQL, then apply them consistently across every student and every month.
- Generate dynamic, live annual summaries: Create a "Year in Review" dashboard that automatically aggregates totals and averages from all monthly sheets, updating instantly with new data entries.
- Eliminate manual date and header adjustments: Let Quadratic automatically increment month headers and adjust reporting periods, removing tedious manual updates.
- Bridge the gap between spreadsheets and databases: Leverage a familiar grid interface with the robust automation and data integrity of Python and SQL, ideal for education administrators.
If you're ready to transform your student performance reporting from a manual burden to an automated, reliable process, Try Quadratic.