
Table of contents
- What is the weighted average method in process costing?
- FIFO vs. weighted average process costing: key differences
- The 5-step process costing workflow
- Practical example: automating costing for Andrews Corporation
- Why modern accounting teams move beyond Excel
- Conclusion
- Use Quadratic to streamline weighted average process costing
Process costing is often cited as one of the most tedious tasks in managerial accounting. Unlike job order costing, where costs are neatly assigned to specific batches, process costing requires you to follow the flow of costs through continuous production departments. The math itself isn't impossible, but maintaining the spreadsheets required to track it is often a nightmare.
The friction point usually lies in the "Equivalent Units of Production" (EUP) calculation. In traditional spreadsheets, tracking beginning inventory, costs added during the period, and ending work in process (WIP) requires a web of interlinked cells. When production volumes change or conversion percentages shift, these brittle formulas often break—a phenomenon known as "link rot."
There is a modern way to handle these calculations. By moving beyond static cells and utilizing a coding spreadsheet like Quadratic, accounting professionals can turn this "black box" of hidden formulas into a "glass box" of clear, auditable logic. In this guide, we will walk through the weighted average process costing method, using a fictional manufacturing entity, Andrews Corporation, to demonstrate how Python-enabled spreadsheets can automate the heavy lifting of cost accounting.
What is the weighted average method in process costing?
The weighted average method in process costing is an inventory valuation technique used to determine the cost per unit of production. It is specifically designed for manufacturing environments where goods are mass-produced in a continuous flow and individual units are indistinguishable from one another.
Ideally, an accountant would track every dollar spent on every specific unit. However, in industries like chemical processing, food manufacturing, or textile production, this is physically impossible. You cannot distinguish one gallon of paint from another in a mixing vat.
To solve this, the weighted average method blends costs together. It combines the costs tied to the beginning inventory (work done in the previous period) with the costs incurred during the current period. The result is a single average cost per equivalent unit. This average is then applied to both the units completed and transferred out, as well as the units remaining in ending inventory.
FIFO vs. weighted average process costing: key differences
Before diving into the calculations, it is helpful to understand where the weighted average method sits in the accounting landscape, particularly in relation to the FIFO vs. weighted average inventory costing method. While both methods aim to allocate costs to inventory, they approach the flow of costs differently.
The difference between weighted average and fifo process costing lies in how they treat beginning inventory. FIFO separates the costs in beginning inventory from the costs added in the current period. It assumes that the first units started are the first ones finished. This results in two separate cost-per-unit calculations: one for the beginning inventory completing its processing, and another for the new units started and finished in the current period. While FIFO provides a more precise reflection of current period efficiency, the calculation is significantly more complex.
In contrast, the weighted average process costing method ignores the distinction between beginning inventory and current production. It assumes all units—whether started last month or yesterday—are commingled. This smoothing effect makes the weighted average method simpler to calculate and often less volatile in periods where input prices fluctuate. Because of its simplicity and ability to smooth out cost spikes, it is the preferred method for many large-scale manufacturers.
The 5-step process costing workflow
Regardless of the software you use, the theoretical framework for process costing remains the same. To reach a final journal entry, an accountant must navigate five distinct steps:
1. Analyze the physical flow of units: Determine how many units were in beginning inventory, how many were started, how many were completed, and how many remain in ending WIP.
2. Calculate equivalent units of production (EUP): Convert partially completed units into "equivalent" fully completed units to standardize the math.
3. Determine total costs: Sum the value of the beginning inventory and the costs added during the current period.
4. Calculate cost per equivalent unit: Divide the total costs (Step 3) by the equivalent units (Step 2).
5. Assign costs: Allocate the cost per unit to the goods transferred to finished goods and the goods remaining in ending WIP.
While these steps are standard, the execution in a traditional spreadsheet is where errors occur. We will look at how to modernize this workflow.
Practical example: automating costing for Andrews Corporation
To illustrate the power of a programmable grid, let’s look at how Andrews Corporation uses the weighted average method of process costing to value their monthly manufacturing output.
Andrews Corporation manufactures high-grade industrial sensors. In their Assembly Department, they have units that were partially finished at the start of the month, units started during the month, and units still in progress at the end of the month.
The data setup
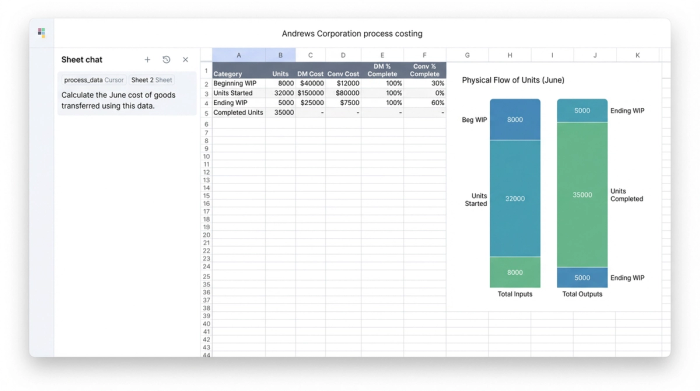
In a standard Excel workflow, you might have raw data scattered across different tabs. In Quadratic, we can ingest this data directly or type it into the grid. Let's assume the following data for the month of June:
- Beginning WIP: 2,000 units (100% complete on materials, 40% complete on conversion). Cost: $15,000 (Materials) + $4,000 (Conversion).
- Units Started: 20,000 units.
- Units Completed & Transferred: 18,000 units.
- Ending WIP: 4,000 units (100% complete on materials, 60% complete on conversion).
- Current Period Costs: $150,000 (Materials) + $85,000 (Conversion).
The goal is to turn this raw data into a clean journal entry without manually linking cells for every step of the calculation.
Step 1 & 2: calculating equivalent units with Python
The most confusing part of process costing is calculating Equivalent Units of Production (EUP). This is because direct materials are often added at the very beginning of the process (100% complete), while conversion costs (labor and overhead) are incurred evenly throughout the process.
In a traditional spreadsheet, calculating EUP usually involves creating "helper columns" to multiply the physical units by the percentage of completion. If the percentage changes, you have to verify that your formulas are referencing the correct cells.
In Quadratic, we treat this as a logic problem, not a cell-referencing problem. We can use Python to define the logic explicitly.
We start by defining our physical flow. We know that 18,000 units were completed. Completed units are always 100% complete for both materials and conversion.
The complexity lies in the ending WIP. We have 4,000 units.
- For Materials: 4,000 units * 100% = 4,000 EUP.
- For Conversion: 4,000 units * 60% = 2,400 EUP.
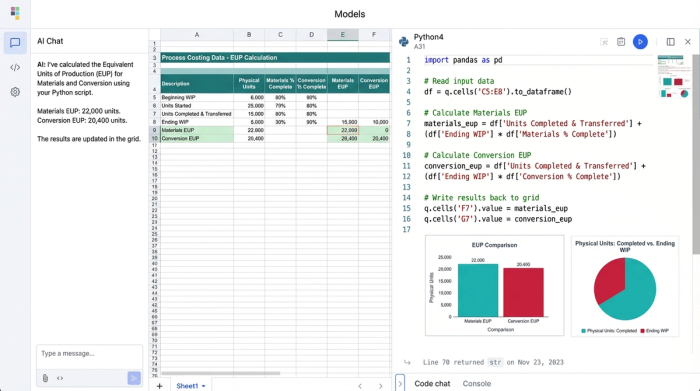
Instead of hiding this math in a cell like =C4*D4, we can write a short Python script in the grid that calculates the total EUP for each category. The script sums the completed units plus the weighted ending WIP.
For Andrews Corporation, the Python output would instantly show:
- Materials EUP: 18,000 (completed) + 4,000 (ending WIP) = 22,000 units.
- Conversion EUP: 18,000 (completed) + 2,400 (ending WIP) = 20,400 units.
By using code, the logic is visible. If an auditor asks how you arrived at 20,400 units, you don't have to click through formula bars; you can show them the script that explicitly multiplies ending inventory by the conversion percentage.
Step 3 & 4: computing cost per unit
Once the equivalent units are established, the next step in the weighted average process costing method example is to determine the cost per unit.
Remember, under the weighted average method, we blend the beginning costs with the current costs.
- Total Materials Cost: $15,000 (Beginning) + $150,000 (Current) = $165,000.
- Total Conversion Cost: $4,000 (Beginning) + $85,000 (Current) = $89,000.
Now, we divide these totals by the EUP calculated in the previous step. In a standard spreadsheet, this is the moment where "hard-coding" errors happen. A user might accidentally type "165000" instead of referencing the calculated sum.
In Quadratic, we continue using variables. We divide the total_materials_cost variable by the materials_eup variable.
- Cost Per Equivalent Unit (Materials): $165,000 / 22,000 = $7.50.
- Cost Per Equivalent Unit (Conversion): $89,000 / 20,400 = $4.36.
- Total Cost Per Unit: $7.50 + $4.36 = $11.86.
The beauty of this approach is its resilience. If Andrews Corporation realizes later that the conversion completion on ending WIP was actually 70%, they simply update the single input variable. The Python script automatically recalculates the EUP, updates the total costs, and adjusts the cost per unit instantly. The logic flow remains intact without the risk of broken cell references.
Step 5: generating the journal entries
The ultimate output of this exercise is not just a calculation; it is a journal entry that needs to be posted to the general ledger. The goal is to move costs out of the "Work in Process" account and into the "Finished Goods" account for the units that were completed.
Using the data calculated above:
- Units Completed: 18,000
- Total Cost Per Unit: $11.86
The value of the goods transferred is 18,000 * $11.86 = $213,480.
In Quadratic, you can format the output of your Python script to look exactly like a standard accounting journal entry table. Instead of copying and pasting values into a separate "presentation" tab, the grid renders the dataframe directly.
Journal Entry:
- Debit: Finished Goods Inventory — $213,480
- Credit: Work in Process Inventory — $213,480
Additionally, the system calculates the value of the ending WIP that remains on the balance sheet.
- Ending WIP Materials: 4,000 units * $7.50 = $30,000
- Ending WIP Conversion: 2,400 units * $4.36 = $10,464
- Total Ending Inventory: $40,464
By automating this, Andrews Corporation ensures that their balance sheet matches their production reality every month, regardless of how complex the underlying unit flows become.
Why modern accounting teams move beyond Excel
The process described above is standard accounting practice, but the tool used to execute it matters. For decades, the weighted average process costing method has been performed in Excel. While Excel is a powerful tool, it operates as a "black box." The logic is hidden behind cell references like !Sheet2:C45, making it difficult to audit and prone to breakage.
Modern accounting teams are moving toward data automation software like Quadratic because they offer a "glass box" environment.
Data integrity is paramount. In a Python-enabled grid, variables are named. You aren't dividing C4 by D9; you are dividing total_cost by equivalent_units. This semantic clarity significantly reduces the risk of manual error. If a formula is wrong, it is obvious in the code, not buried in a hidden cell.
Complexity management becomes easier. Real-world manufacturing often involves multiple departments (e.g., Mixing to Refining to Packaging). In Excel, this requires massive workbooks with interlinked tabs. In Quadratic, you can manage these departmental flows using structured data and scripts, keeping the workspace clean and the processing speed fast.
Presentation is separated from calculation. One of the biggest struggles in accounting is presenting data to management. Spreadsheets often become cluttered with "scratchpad" calculations. By doing the heavy math in Python code blocks, the grid itself remains clean, displaying only the final, formatted journal entries and summary tables that a CFO needs to see.
Conclusion
Weighted average process costing is a fundamental requirement for continuous manufacturing, but the complexity of the math shouldn't burden your accounting team. The friction often comes not from the accounting concepts themselves, but from the limitations of the tools used to calculate them.
By utilizing a tool that combines the familiarity of a spreadsheet with the power of Python, you can transform a brittle, manual process into a repeatable, automated data processing workflow. For companies like Andrews Corporation, this means faster month-end closes, audit-ready data, and a clear view of their production costs, enabling more accurate financial data analysis.
If you are tired of chasing broken formulas and want to see how a programmable grid can streamline your accounting journal entries, try the process costing workflow in Quadratic. It’s time to stop calculating in the dark and start working in a glass box.
Use Quadratic to streamline weighted average process costing
- Automate complex equivalent units of production (EUP) calculations using clear Python logic, eliminating brittle cell references and the risk of "link rot."
- Ensure audit-ready cost calculations by explicitly defining cost flows and unit percentages in visible code, rather than hidden spreadsheet formulas.
- Instantly recalculate all process costing steps—from EUP to cost per unit and journal entries—when inputs like conversion percentages or production volumes change, maintaining data integrity.
- Manage multi-departmental cost flows within a single, clean workspace using structured data and Python scripts, avoiding cluttered workbooks and interlinked tabs.
- Generate accurate, formatted journal entries and ending work-in-process valuations directly from your calculations, eliminating manual data transfer and presentation cleanup.
Stop chasing broken formulas and start working with clear, auditable data. Try Quadratic to streamline your process costing.