Making confident optimization decisions requires more than gut feelings—you need statistical proof. Our A/B test calculator template eliminates the complexity of manual calculations, helping you quickly determine whether your test results are statistically significant and actionable.
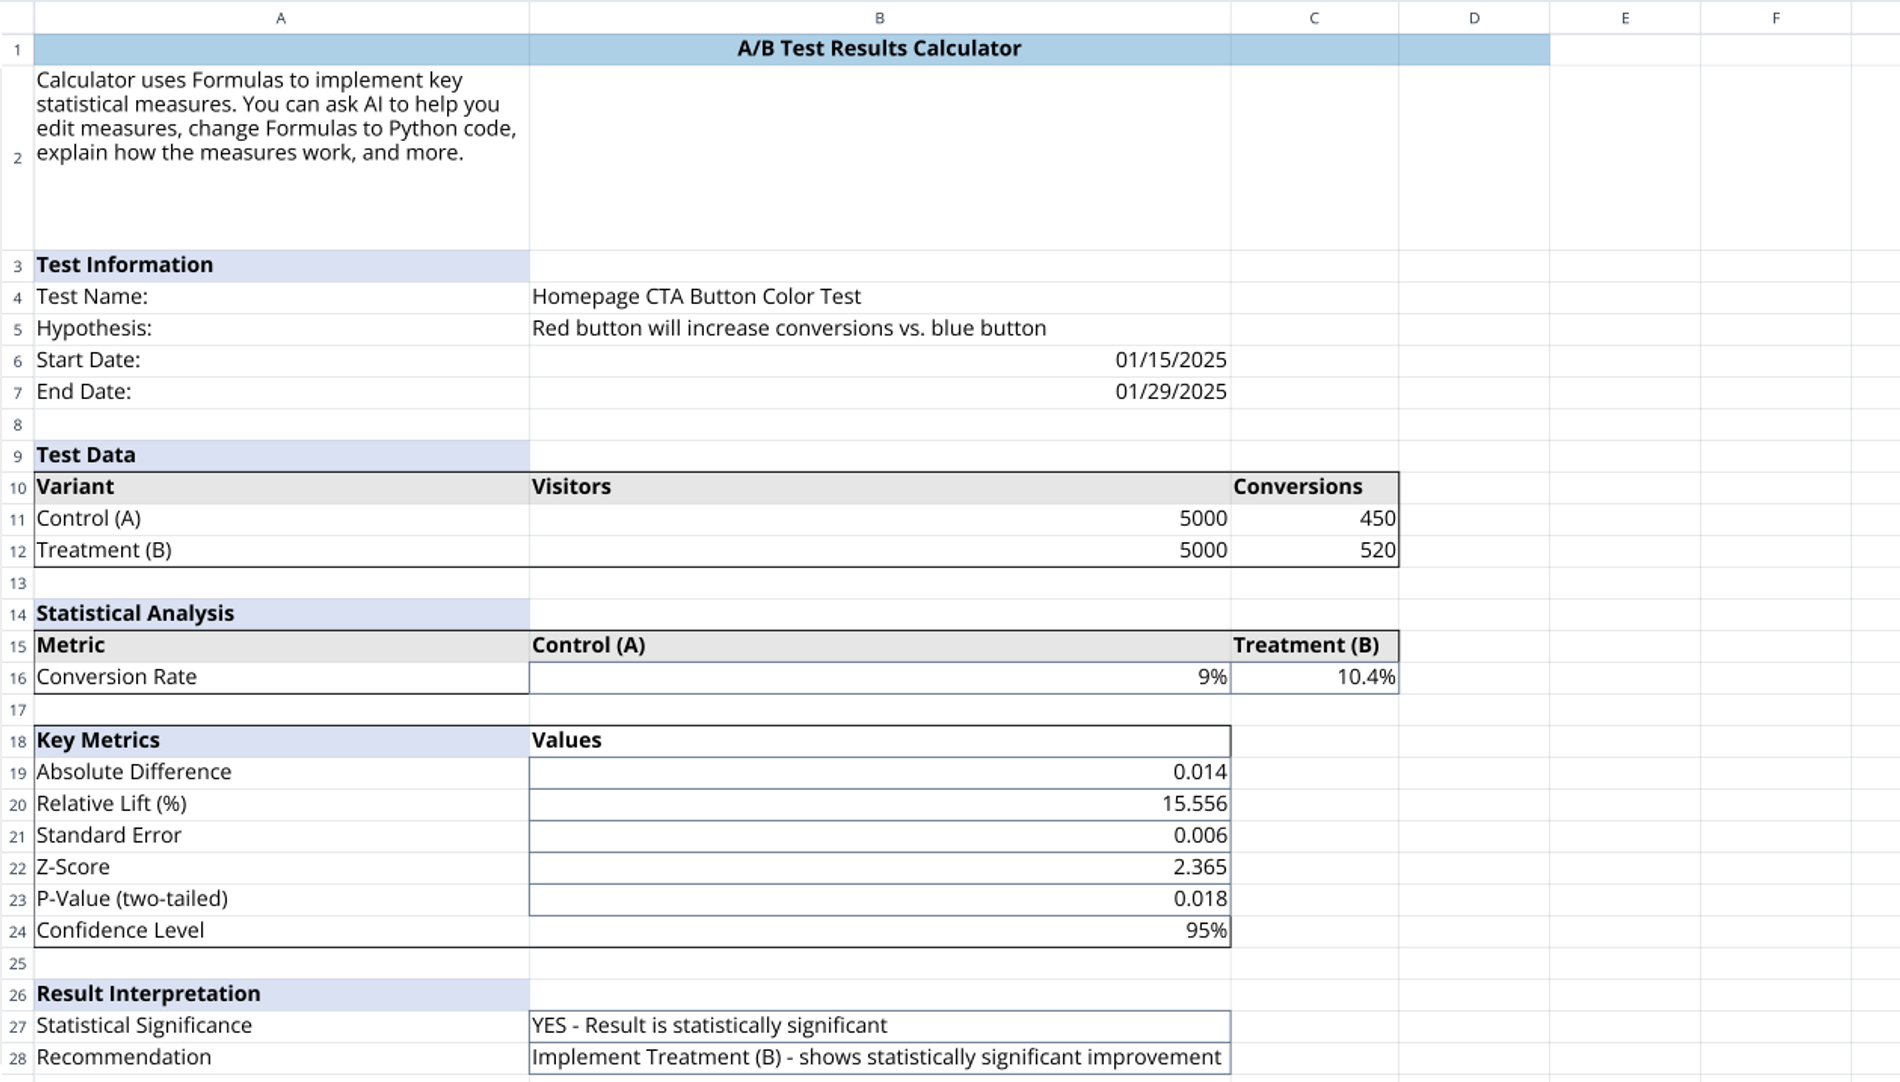
This a/b testing calculator automatically computes essential metrics including conversion rates, relative lift, z-scores, p-values, and statistical significance. Whether you're testing landing pages, email campaigns, or product features, this template provides clear, immediate insights into which variant performs better—and whether those results are reliable.
How to use this A/B testing template
Getting started is straightforward:
- Document your test by entering the test name, hypothesis, and date range to maintain proper experiment tracking
- Input your data by filling in visitor counts and conversions for both your Control (A) and Treatment (B) variants
- Review automated calculations that instantly display conversion rates, absolute differences, relative lift percentages, and key statistical measures
- Interpret results with built-in guidance showing whether your test achieved statistical significance and actionable recommendations
The template uses formulas to power all calculations, which you can customize or convert to Python code based on your expertise level. This a/b testing significance calculator works at a standard 95% confidence level, ensuring your decisions are backed by industry-standard statistical rigor.
Best practices: Run tests until you achieve adequate sample sizes, avoid stopping tests prematurely based on early results, and always formulate clear hypotheses before launching experiments.
Who benefits from this A/B split test calculator
This A/B testing template is designed for:
- Digital marketers optimizing ad copy, CTAs, and landing page elements
- Product managers validating feature changes and user experience improvements
- E-commerce teams testing checkout flows, product imagery, and pricing strategies
- Growth teams running continuous optimization programs across customer touchpoints
- UX designers evaluating design variations with quantifiable outcomes
- Small business owners making informed marketing decisions without expensive analytics platforms
Real-world applications include testing homepage button colors (like the example included), comparing email subject lines, evaluating pricing page layouts, or measuring the impact of navigation menu changes. Unlike traditional A/B testing Excel template solutions, this template works in Quadratic's modern spreadsheet environment, allowing you to combine formula-based calculations with AI assistance and Python code when needed.
Why this A/B testing dashboard stands out
This isn't just another spreadsheet—it's an interactive A/B testing dashboard that combines simplicity with statistical rigor. The template clearly labels each metric, provides interpretation guidance, and delivers actionable recommendations automatically. You can ask Quadratic's AI to explain any statistical concept, modify calculations, or even transform formulas into Python for advanced analysis.
Ready to make better-informed decisions? Duplicate this free template and start validating your optimization hypotheses with confidence. Stop guessing and start testing with statistical certainty.