How the sales commission calculator works
This template consolidates transaction data, quota definitions, and incentive rules into a unified workflow. It replaces fragile spreadsheet formulas with Python logic to join relational data tables and compute complex payouts.
- Unified workflow: Connects raw sales logs with configuration tables to automate the entire calculation process.
- Python-driven logic: Uses Python code cells to join tables and apply logic for base rates, tiers, and accelerators.
- Automatic adjustments: Applies progressive tiers and quota attainment accelerators dynamically based on performance data.
- The template features Sales Data Visualization that visualizes individual performance and total compensation costs via interactive Plotly charts.
Managing transaction data
The Sales_Transactions table on the Sales Data sheet serves as the primary input log for all deal activity. It captures essential fields including the date, sales representative ID, product ID, sale amount, and deal status.
- Stores closed deal records used to calculate sales commission for specific periods, such as the sample data provided for January 2026.
- Allows for continuous data entry as new deals close, serving as the single source of truth for raw performance data.
- Feeds directly into the Python calculation layer, ensuring that any update to the transaction log is immediately reflected in the dashboard.
Configuring commission logic
Defining commission tiers
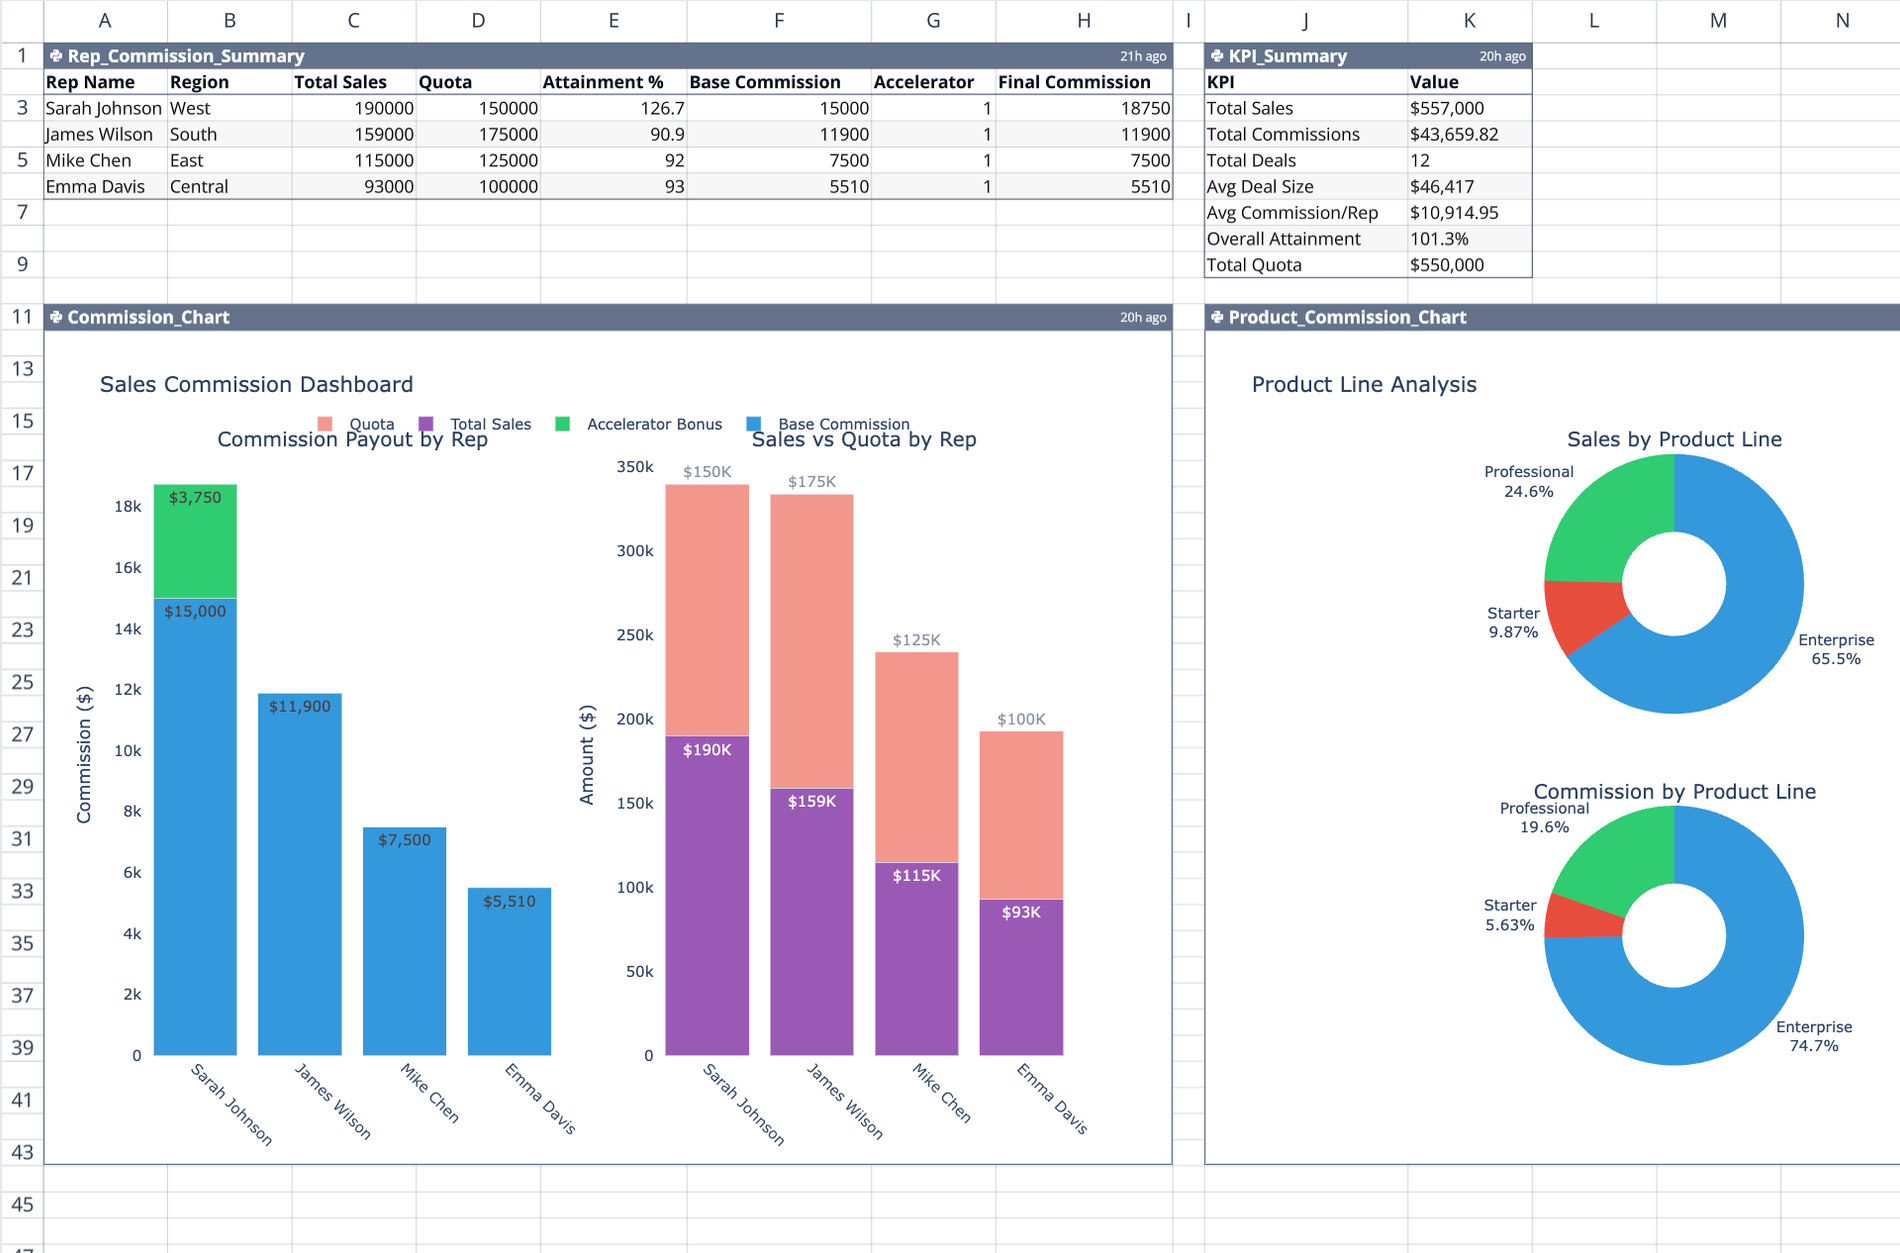
The Commission_Tiers table establishes progressive rate structures, mapping sales volume ranges to specific percentage payouts. In the template, this structure ranges from 5% for lower volumes up to 12% for high-performance brackets. This table enables users to customize bracket thresholds for base commission calculations without altering the underlying code.
Setting accelerators and quotas
Two reference tables manage individual goals and performance multipliers:
- Sales_Reps table: Assigns individual quotas and sales regions to specific representatives.
- Accelerators table: Defines multipliers based on the percentage of quota attained.
- Threshold logic: Links attainment thresholds (e.g., 100% to 175%) to payout multipliers (1.0x to 1.75x), ensuring that high performers are automatically rewarded according to the defined rules.
Assigning product rates
The Product_Lines table sets distinct commission percentages by product type, allowing for differentiated payouts across inventory categories. The template demonstrates this by assigning specific rates to Enterprise (10%), Professional (7%), and Starter (5%) packages.
Automating commission calculations
Aggregating rep performance
The Rep_Commission_Summary code cell on the Dashboard sheet groups transactional data by sales representative. It joins the transaction logs with the Sales_Reps table to compare actual sales against assigned quotas. This step calculates overall attainment percentages, which determines eligibility for performance accelerators.
Applying the commission formula
A Python script automates the final payout calculation by looking up the applicable base rate from the tier structure and identifying the correct accelerator multiplier based on attainment.
- Logic flow: The script applies the formula: (Base Commission) × (Accelerator Multiplier).
- Error reduction: This method eliminates manual errors associated with complex spreadsheet lookup formulas.
- Sample output: In the template data, the script calculates that a representative with 126.7% attainment receives a 1.25x accelerator, while others below 100% receive the standard rate.
Visualizing compensation and KPIs
Dashboard metrics
The KPI_Summary cell generates high-level performance indicators for the entire team. It displays total sales volume, total commissions paid, and the average deal size, offering key metrics for financial data visualization. Additionally, it calculates the overall quota attainment across the organization, providing a snapshot of program health.
Performance charts
Two Python-generated Plotly charts provide immediate visual feedback on the incentive program:
- Commission_Chart: Visualizes total payout distribution by representative, allowing for quick comparison of individual earnings.
- Product_Commission_Chart: Breaks down compensation costs by product line to identify which inventory categories are driving commission expenses.
Who this Sales Commission Calculator is for
- Sales operations managers needing to automate commission calculations for sales teams without manual spreadsheet maintenance.
- Finance teams requiring a transparent, auditable method to calculate sales commission that reduces the risk of formula errors.
- Sales directors looking to model how accelerators, tiers, and product-specific rates impact total compensation costs, potentially through a Monte Carlo simulation template.
Use Quadratic to calculate sales commissions
- Consolidate transaction data, quota definitions, and incentive rules into a single workflow.
- Apply complex commission logic using Python code for base rates, tiers, and accelerators.
- Dynamically adjust payouts based on progressive tiers and quota attainment accelerators.
- Eliminate manual errors often found in complex spreadsheet lookup formulas.
- Visualize individual performance and total compensation costs with interactive charts.
- Maintain a transparent and auditable method for sales commission calculations.