Transform your key performance indicators into actionable insights with this comprehensive KPI dashboard template. Designed for modern data-driven organizations, this template combines traditional spreadsheet functionality with powerful visualization tools to create a complete performance monitoring solution.
What this template offers
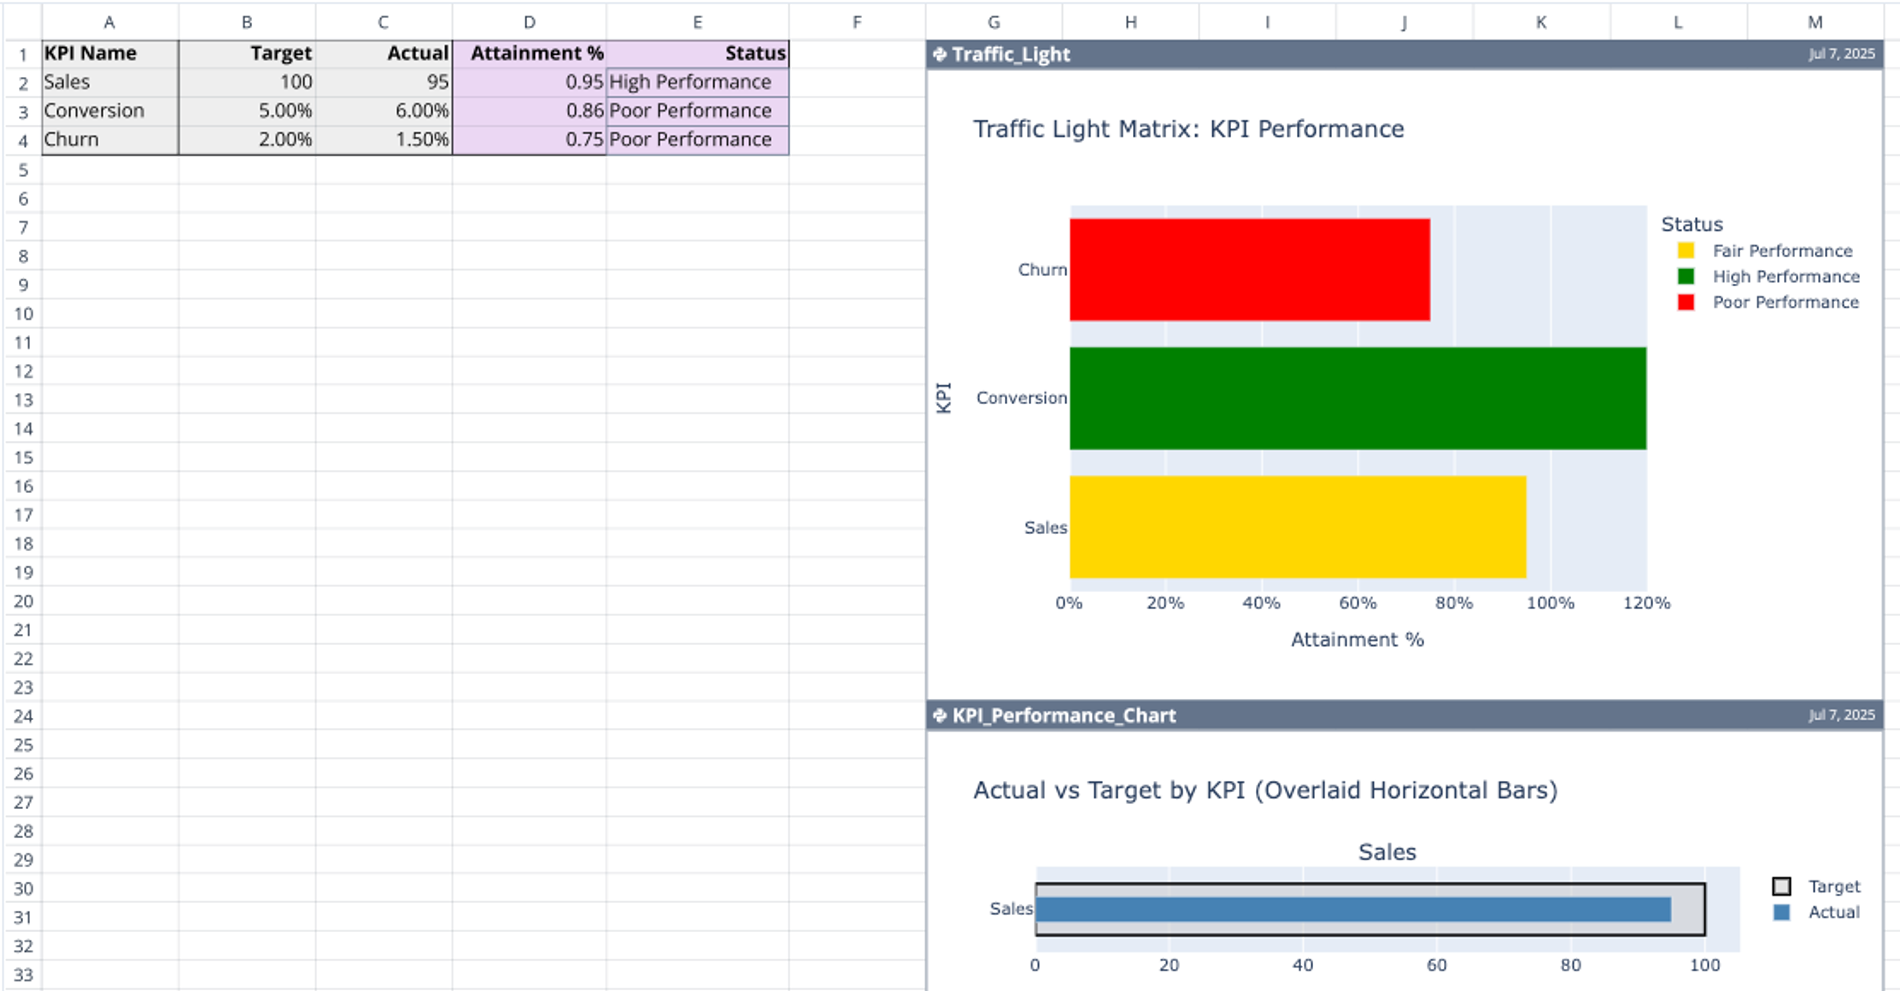
This sample KPI dashboard goes beyond basic tracking by providing automated calculations and dynamic visual representations of your metrics. The template includes pre-built performance categories (High, Fair, and Poor Performance) with color-coded traffic light indicators, making it instantly clear which KPIs need attention. Users can input their targets and actual values, and the system automatically calculates attainment percentages and assigns performance status.
How to use this template
Getting started is straightforward: simply replace the sample data with your own KPIs, targets, and actual values. The template functions as both a KPI calculator and visualization engine. Enter your metrics in the data table, and watch as the charts automatically update to reflect your performance.
The dual-chart system provides comprehensive analysis: the traffic light matrix offers quick status overview, while the overlaid bar chart shows detailed target versus actual comparisons. This approach eliminates manual KPI calculation work while providing professional-grade analytics.
Best practice tip: Update your data regularly and use consistent measurement periods to maintain accurate trend analysis. Add in short-term goals and generate charts to track tasks along the way across different departments.
Who benefits most
This template serves business analysts, team leaders, department heads, and small business owners who need to monitor performance metrics without complex software. It's particularly valuable for:
- Sales teams tracking revenue, conversion rates, and customer acquisition
- Marketing departments monitoring campaign performance and ROI
- Operations managers overseeing efficiency and quality metrics
- Project managers tracking milestone completion and resource utilization
The template scales from individual contributor tracking to executive-level dashboards, making it versatile for organizations of any size.
Advanced features
Unlike static spreadsheets, this KPI calculator template leverages Python-powered analytics for dynamic visualizations. The automated KPI calculations ensure accuracy while the interactive charts provide immediate visual feedback. The traffic light system uses industry-standard performance thresholds (90%+ for fair, 100%+ for high performance) that can be customized for your specific needs.
The KPI dashboard demonstrates Quadratic's unique ability to combine familiar spreadsheet interfaces with modern programming capabilities, offering the accessibility of traditional tools with the power of advanced analytics.
Real-world applications
Whether you're managing quarterly business reviews, monthly team check-ins, or weekly performance updates, this KPI calculator adapts to your reporting cycle. The visual elements make it perfect for presentations, while the underlying data structure supports detailed analysis and trend identification.
Ready to elevate your performance tracking? Download this KPI dashboard template and experience how modern spreadsheet technology can transform your data into compelling visual stories. Start monitoring your success metrics with professional-grade analytics today.
Related templates
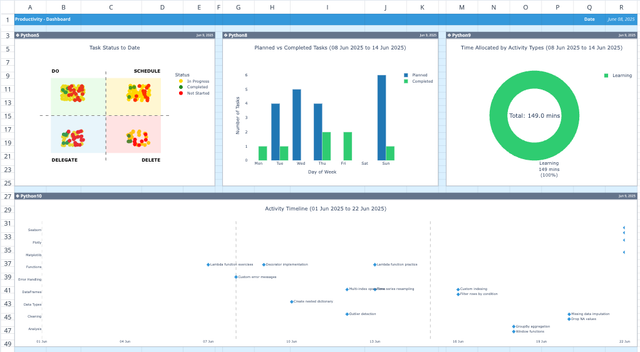
Goal Tracker and Productivity Template
Track tasks, analyze time allocation, and visualize goal progress.
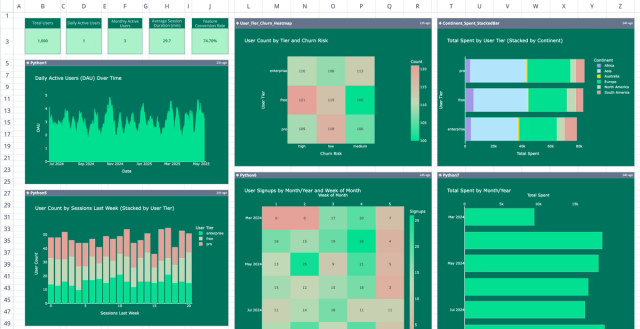
Product User Metrics Dashboard Template
Visualize and analyze user behavior with a comprehensive app usage dashboard.
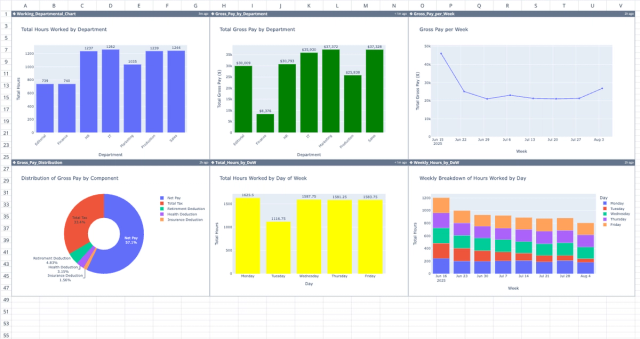
Professional Payroll Template
Automate payment calculations and spot trends with a dynamic dashboard.