Purpose of this rental property tracker
This template provides a programmable solution for tracking real estate finances. It consolidates rental income and expense data into a single view, automating the calculation of annual and monthly financial performance, much like a profit and loss statement template. By visualizing liquidity trends, it helps users identify negative cash flow periods and serves as a dynamic cash flow statement template for real estate management.
Template components
Transactions table
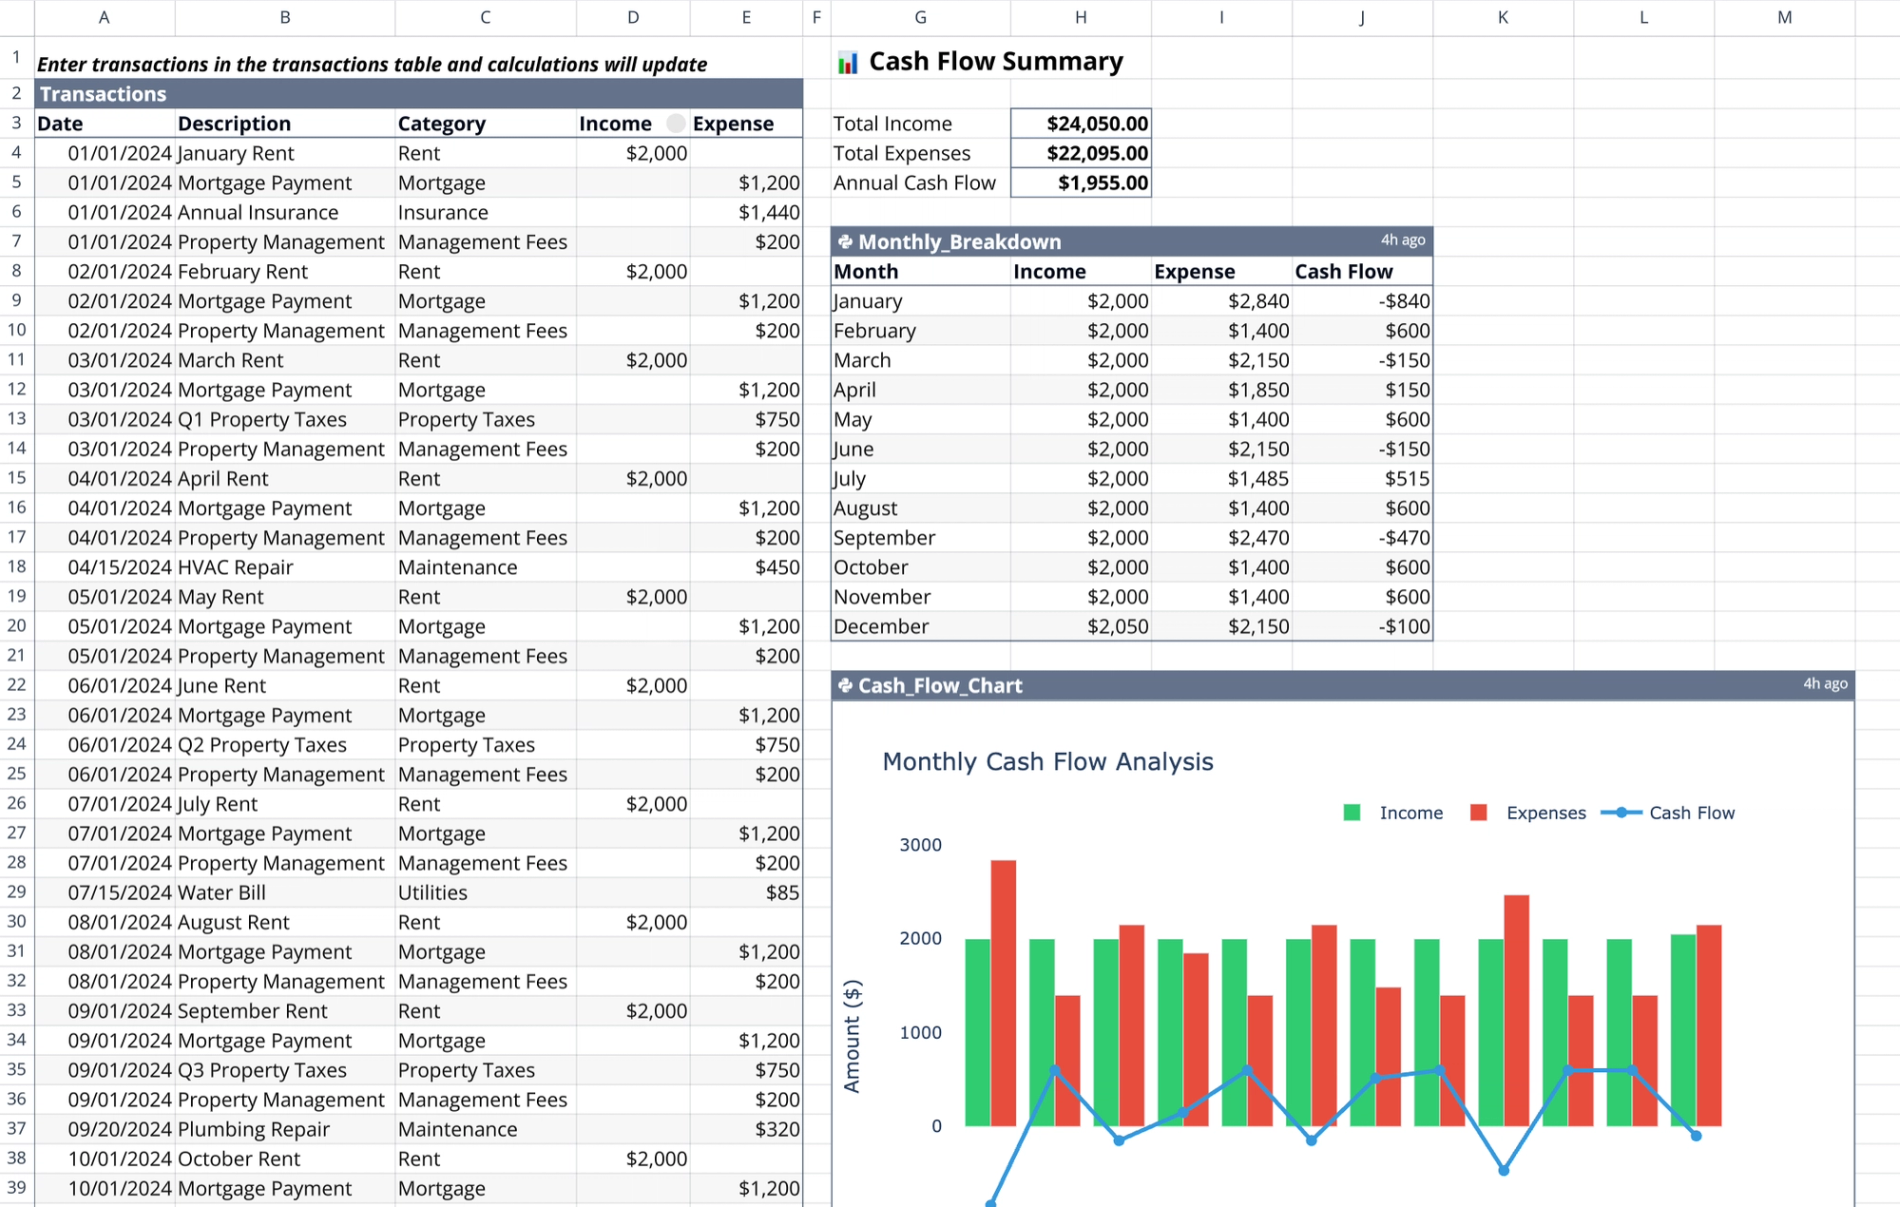
Located in the range A2:E48, this table captures raw financial data including Date, Description, and Category. It utilizes distinct Income and Expense columns for entry separation. Users must leave the opposing column blank for each transaction row to ensure accurate processing by the Python logic.
Summary metrics
The summary section, located in range G3:H6, provides a high-level snapshot of financial health. It aggregates Total Income and Total Expenses directly from the transactions list and calculates Annual Cash Flow by subtracting total expenses from total income.
Monthly breakdown analysis
Powered by the "Monthly_Breakdown" Python cell (G7:J20), this component groups raw transaction data by month. It sums income and expenses per month to determine net monthly cash flow, generating a structured table that acts as a practical statement of cash flows example.
Data visualization
The visualization component is powered by the "Cash_Flow_Chart" Python cell (G22:M44). Using the Plotly library, it renders monthly data to visualize positive and negative trends, highlighting the impacts of irregular costs like property taxes or insurance payments.
How to use the cash flow statement template
Entering financial data
Begin by logging financial events in the Transactions table. Input rent collections into the Income column and log recurring or one-time costs—such as mortgages, insurance, and repairs—in the Expense column for effective business expense tracking. Ensure dates are accurate to allow for correct Python grouping.
Interpreting the automated output
Once data is entered, review the Python-generated monthly table to spot profitability gaps, a key objective of P&L Analysis. Analyze the Plotly chart to visualize seasonal financial health and use the summary section for high-level annual performance checks, which are crucial for comprehensive financial analysis.
Updating the tracker
To update the tracker, simply add or modify rows in the Transactions table. The template reacts immediately to changes; Python cells re-execute automatically to update the breakdown table and chart without requiring a manual refresh.
Who this cash flow statement template is for
- Landlords managing residential or commercial units can streamline their operations with a rent roll template.
- Property managers requiring quick financial snapshots.
- Real estate investors tracking performance across fiscal years can leverage an investment tracking spreadsheet for comprehensive oversight.
Use Quadratic to track rental property cash flow
- Consolidate all rental income and expenses into a single transactions table.
- Automatically calculate annual and monthly cash flow with embedded Python logic.
- Visualize liquidity trends and identify negative cash flow periods using dynamic Plotly charts.
- Update financial data instantly, with all summaries and visualizations re-executing automatically.
- Spot profitability gaps and analyze seasonal financial health for informed real estate management.
Related templates
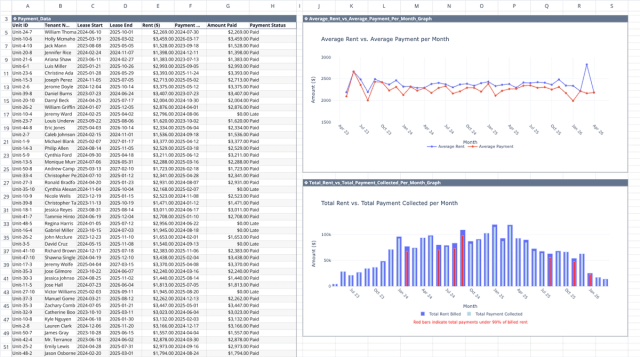
Rent Roll Template
Track rental payments, analyze collection patterns, and identify revenue optimization opportunities.

Real Estate Pro Forma Template
Quickly evaluate potential real estate investments. Track income and expenses, Determine IRR and analyze equity building of real estate.
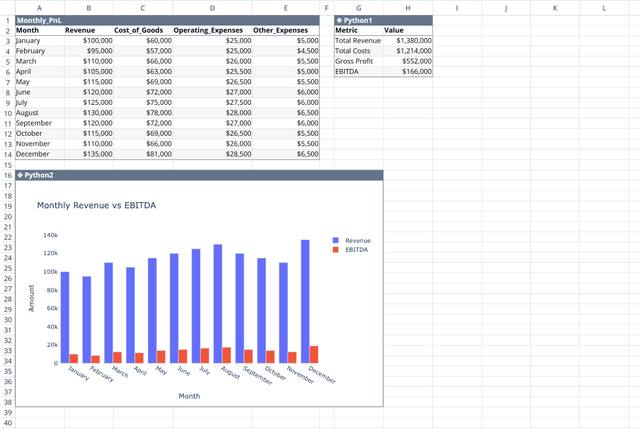
Profit and Loss Statement Template
Streamline monthly financial tracking with an automated dashboard.