Make smarter pricing decisions with this interactive marginal revenue calculator designed to help you understand the financial impact of price changes on your business.
This dynamic template enables you to perform comprehensive marginal revenue calculations while visualizing how different pricing strategies affect your bottom line. Whether you're testing new price points or optimizing existing ones, this tool transforms complex economic concepts into actionable insights through automated calculations and real-time visual dashboards.
Perfect for businesses looking to calculate marginal revenue and understand price elasticity, this template goes beyond a traditional marginal revenue Excel template by offering interactive charts, scenario planning, and instant feedback on your pricing experiments.
How to use it
Getting started is straightforward. Simply edit the Base Parameters including your current price, monthly users, variable cost per user, fixed costs, and price elasticity. As you adjust these values, the entire spreadsheet updates automatically—no formulas to write or code to manage.
The template immediately calculates your Current Metrics including monthly revenue, total variable costs, contribution margin (both dollar and percentage), and net profit. This helps you calculate revenue from cost and margin with precision.
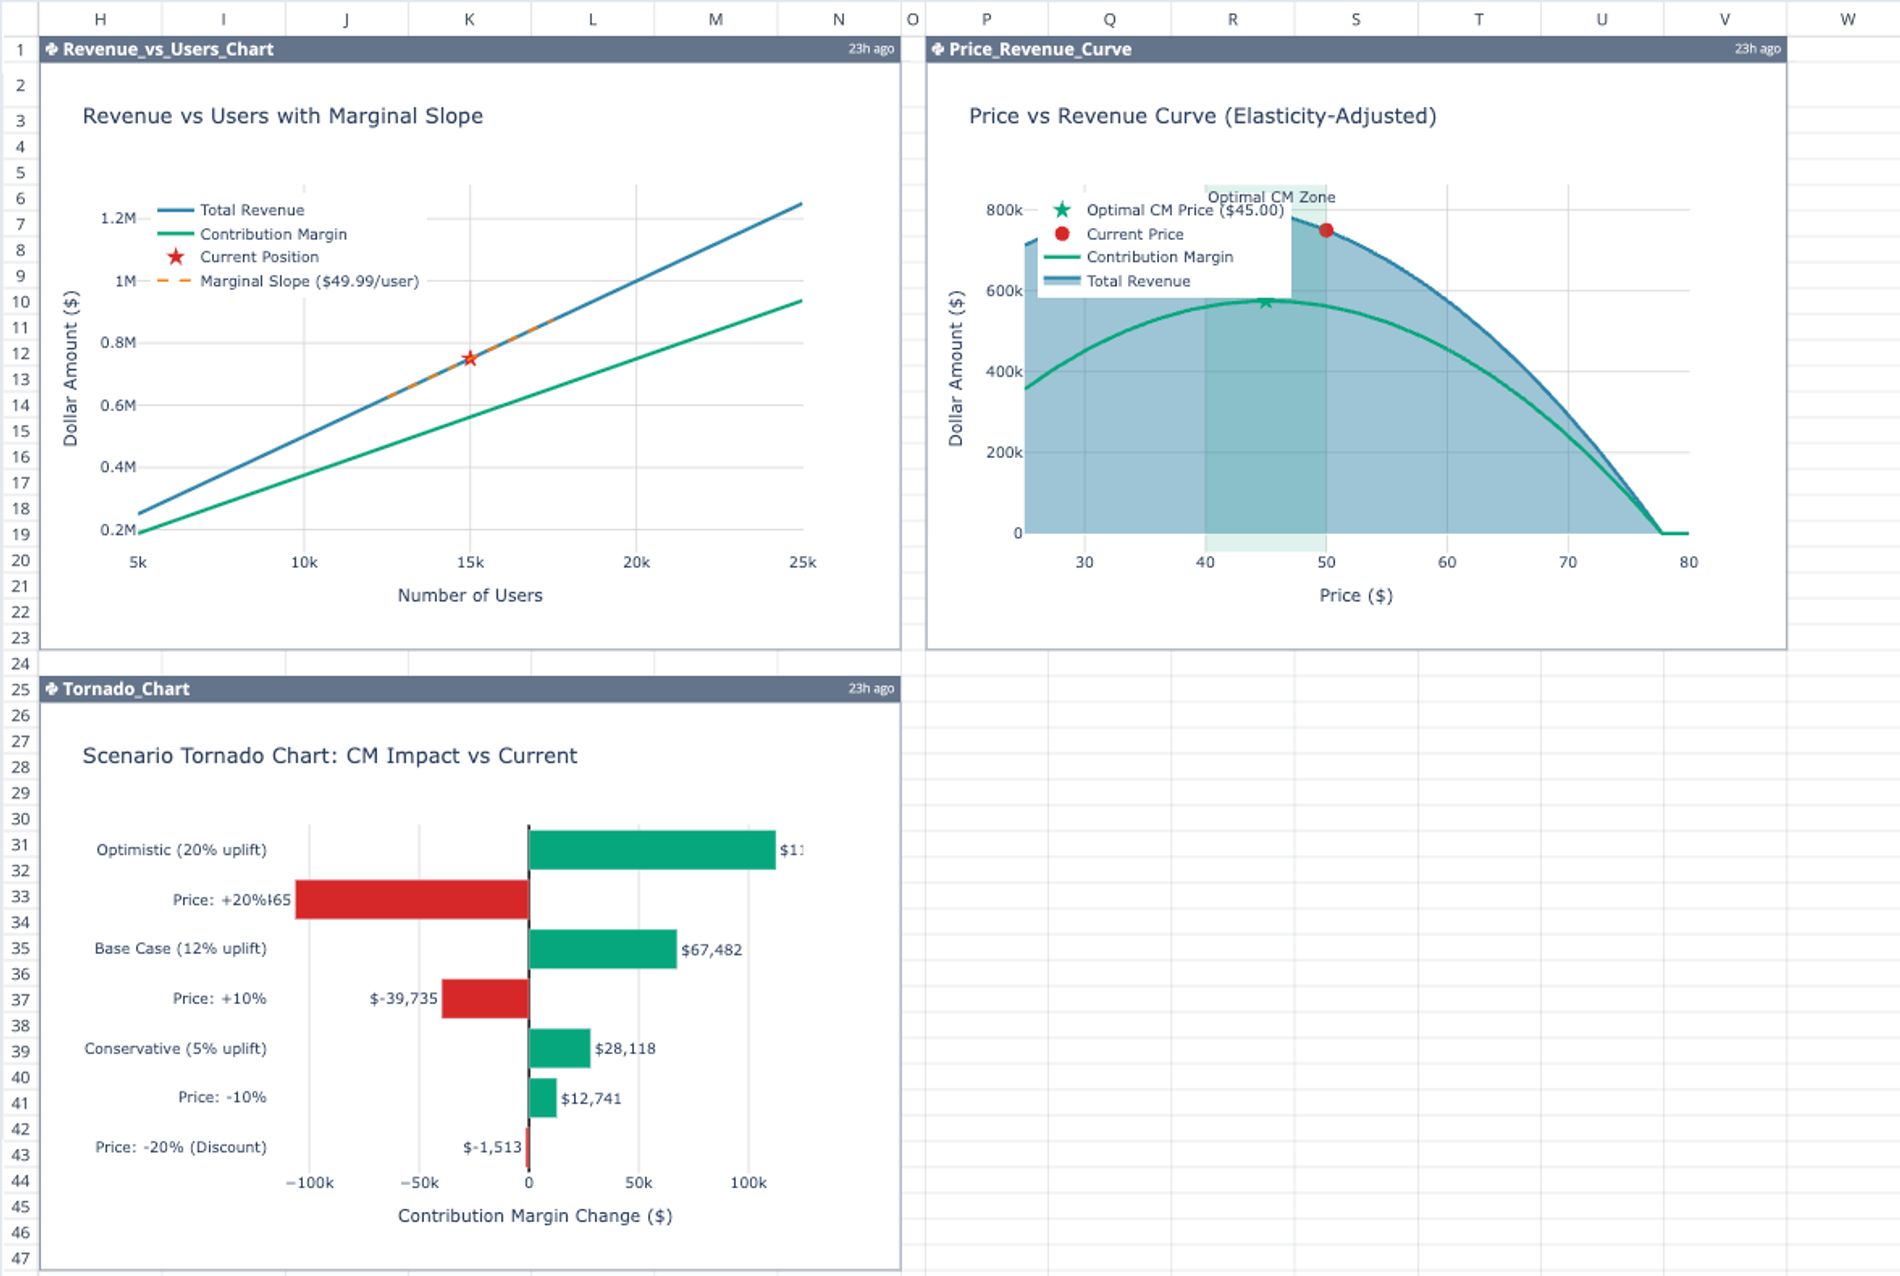
Explore three pre-built Experiment Scenarios (Conservative, Base Case, and Optimistic) that show how user growth impacts your revenue and contribution margin. The Price Change Scenarios section demonstrates what happens when you adjust pricing from -20% (discount) to +30% (premium), showing estimated users, revenue, and changes versus your baseline.
Best Practice Tip: Start by entering your actual business data, then experiment with the price elasticity value to match your market reality. Use the visual charts to quickly identify your optimal price point—where the Price Revenue Curve peaks shows your maximum revenue potential.
Who it's for
This marginal revenue calculator serves product managers, pricing strategists, business analysts, and startup founders who need to make data-driven pricing decisions. SaaS companies will find it particularly valuable for subscription pricing optimization, while e-commerce businesses can use it to test promotional strategies.
Real-life use cases include:
- A SaaS startup determining initial pricing tiers
- An established business evaluating the impact of a price increase
- Marketing teams assessing discount campaign profitability
- Finance departments performing marginal revenue product calculations for budget planning
Key highlights
Unlike static spreadsheets, this template features interactive visualizations including tornado charts for sensitivity analysis and revenue curves that update in real-time. The Python-powered charts provide professional-grade analytics without requiring coding knowledge, making sophisticated marginal revenue calculation accessible to everyone.
Ready to optimize your pricing?
Download this template today and start making confident pricing decisions backed by data. Whether you're launching a new product or optimizing existing revenue streams, this marginal revenue calculator provides the insights you need to maximize profitability.
Related templates
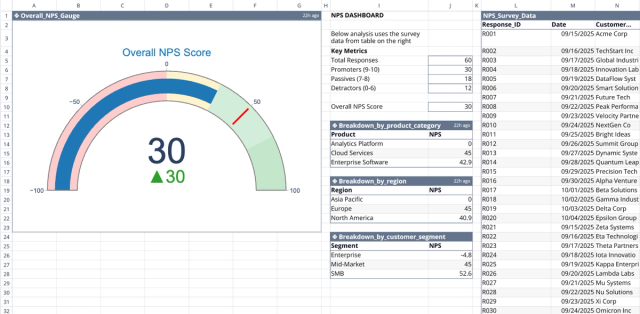
NPS Dashboard Template
Calculate NPS, segment responses, track satisfaction, and reduce churn.
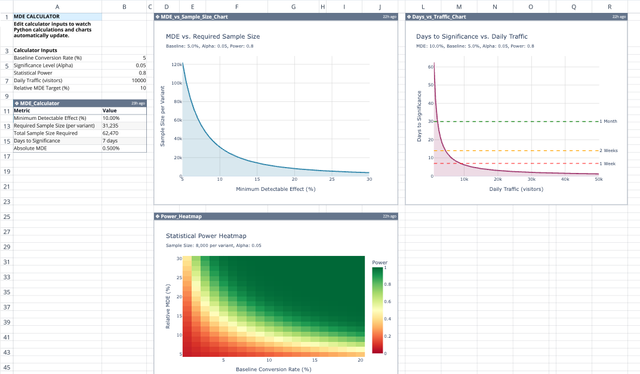
MDE Calculator Template
Plan statistically significant A/B tests with minimum detectable effect.
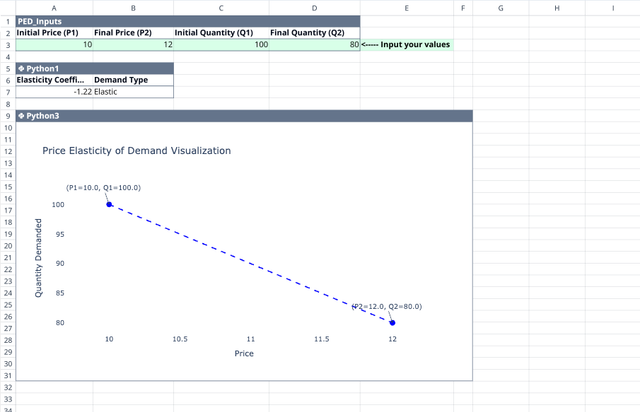
Price Elasticity of Demand Calculator
Compute elasticity coefficients, classify demand types, and visualize demand curves.