The MDE Calculator template helps you plan A/B tests with statistical confidence. This interactive MDE sample size calculator automatically computes the minimum detectable effect (MDE), required sample sizes, and days to significance based on your test parameters. Whether you're optimizing conversion rates, testing new features, or validating design changes, this template takes the guesswork out of experiment planning by providing instant, data-driven insights through automated Python calculations and visual analytics.
Key benefits include eliminating underpowered tests, optimizing resource allocation, and setting realistic expectations for stakeholders. Use this template when launching new experiments, evaluating test feasibility, or educating teams on statistical concepts.
How users interact
Getting started is straightforward:
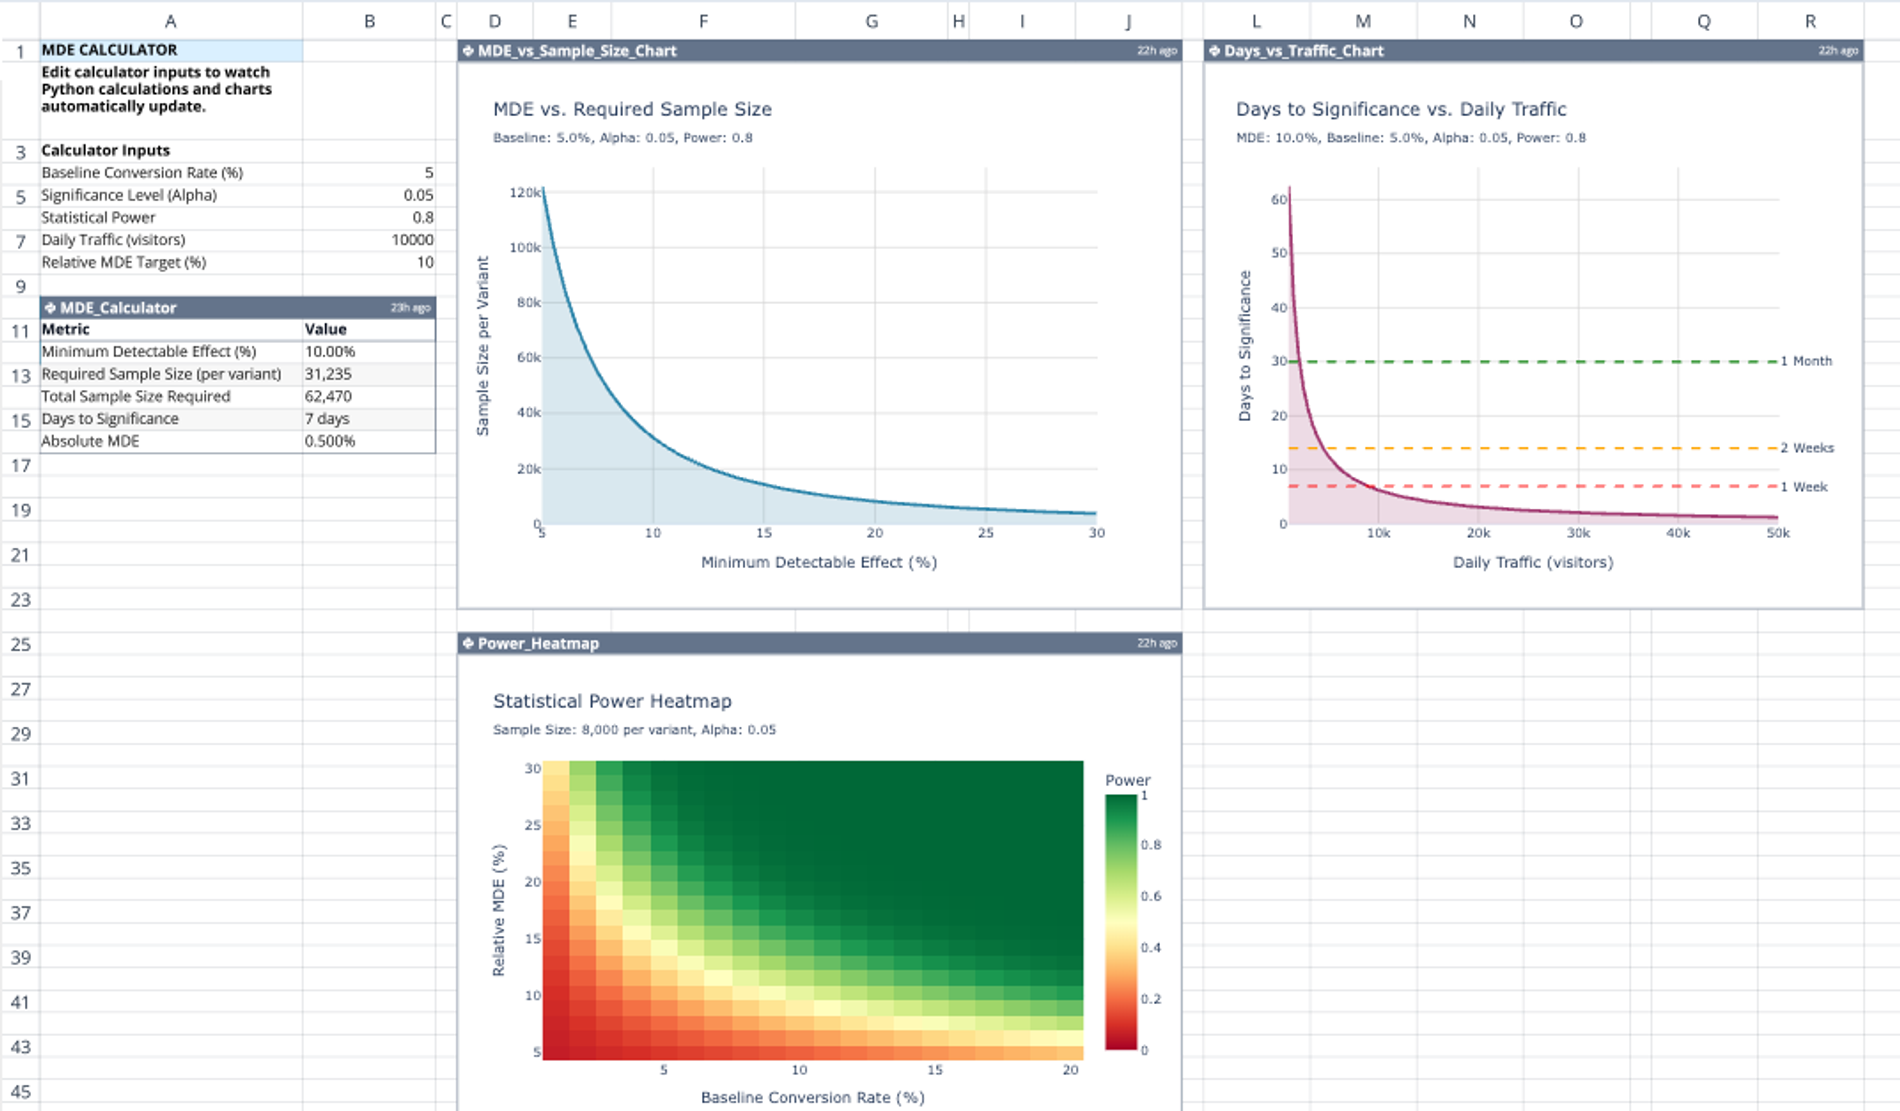
1. Input Your Parameters - Edit the five calculator inputs in column B:
- Baseline Conversion Rate (current performance metric)
- Significance Level (typically 0.05 for 95% confidence)
- Statistical Power (commonly 0.80 or 80%)
- Daily Traffic (average visitors per day)
- Relative MDE Target (desired percentage lift)
2. Review Automated Results - The MDE_Calculator table instantly displays:
- Minimum Detectable Effect as a percentage
- Required sample size per variant
- Total sample size needed
- Estimated days to reach significance
- Absolute MDE value
3. Analyze Visual Insights - Three interactive charts automatically update:
- MDE vs. Sample Size Chart: Understand the trade-off between detecting smaller effects and required sample sizes
- Power Heatmap: Visualize how different MDE and sample size combinations affect statistical power
- Days vs. Traffic Chart: Estimate test duration across various traffic levels
Best Practices: Start with industry-standard values (5% significance level, 80% power), then adjust based on your risk tolerance. Conservative estimates prevent premature test conclusions.
Who it's for
This MDE calculator is essential for:
- Product Managers planning feature rollouts and prioritizing experiments
- Marketing Teams optimizing campaigns and landing pages
- Data Analysts designing rigorous experimentation frameworks
- UX Researchers validating design improvements
- Growth Teams at startups and enterprises maximizing conversion rates
Real-Life Use Cases: An e-commerce team uses the template to determine they need 62,470 total visitors (31,235 per variant) to detect a 10% conversion lift with 80% power. A SaaS company discovers their current traffic requires 45 days to achieve statistical significance, prompting them to adjust their testing roadmap.
Key highlights
Unlike static calculators, this template features live Python computations that update instantly as you modify inputs—no manual recalculation needed. The visual dashboards transform complex statistical concepts into intuitive graphics, making MDE calculation accessible to non-statisticians while maintaining analytical rigor.
The template demonstrates Quadratic's ability to combine spreadsheet familiarity with coding power, offering automated analytics typically requiring specialized tools.
Ready to run smarter A/B tests? Duplicate this free template today and start making data-informed decisions about your experimentation strategy. Stop guessing—calculate MDE with confidence.