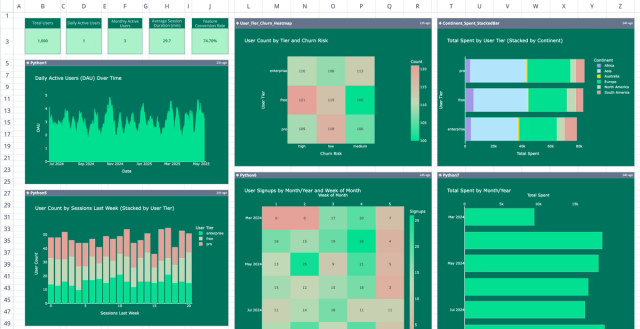
Transform customer feedback into actionable insights with this comprehensive NPS dashboard template. Designed for teams who want to move beyond basic NPS calculation, this template combines automated scoring, visual analytics, and segmentation analysis—all within a modern spreadsheet interface.
What this template does
This net promoter score calculator streamlines the entire NPS workflow. Simply input survey responses, and the template automatically categorizes customers as Promoters, Passives, or Detractors while calculating your overall score. Unlike traditional net promoter score Excel templates, this solution leverages Python-powered analytics to deliver real-time insights without complex formulas.
The built-in NPS dashboard features an intuitive gauge chart that visualizes your score at a glance, plus breakdown tables that segment performance by product category, region, and customer segment. This multi-dimensional view helps you identify exactly where your customer experience shines—and where improvement is needed.
How to use this template
Getting Started:
- Replace the sample data in the NPS_Survey_Data table with your own survey responses
- Ensure each response includes the customer score (0-10), product category, region, and segment
- Watch as the dashboard automatically updates with your calculated NPS and breakdowns
Best Practices:
- Update data regularly to track trends over time
- Use the segmentation tables to identify which products, regions, or customer types need attention
- Compare scores across different time periods by creating duplicate sheets for historical tracking
- Export visualizations for presentations using Quadratic's built-in export features
The template handles all NPS score calculator logic automatically, so you can focus on analysis rather than manual computation.
Who benefits from this template
This NPS chart template is ideal for:
- Customer Success Teams tracking satisfaction metrics and identifying at-risk accounts
- Product Managers measuring feature adoption and user satisfaction across different segments
- SaaS Companies monitoring subscription health and customer loyalty
- Marketing Professionals evaluating campaign effectiveness and brand perception
- Business Analysts preparing executive dashboards and quarterly reviews
Real-World Applications: A software company might use this template to discover that their Enterprise segment has a negative NPS while SMB customers are highly satisfied, prompting targeted improvements to their enterprise onboarding process. Regional teams can identify geographic trends, while product managers can pinpoint which features drive loyalty.
Why this template stands out
Unlike static NPS dashboard Excel templates, this solution combines the familiarity of spreadsheets with the power of Python analytics. The automated calculate NPS functionality eliminates errors, while the visual dashboard makes insights immediately accessible to stakeholders at all technical levels.
Ready to understand your customers better? Start tracking your Net Promoter Score today with this free template. Input your data and gain instant visibility into customer sentiment across every dimension of your business.
Related templates

A/B Test Calculator
Transform your experiments into data-driven decisions.

Customer Retention Rate Calculator
Track customer churn, monitor engagement, and visualize retention trends with real-time data.

Product User Metrics Dashboard Template
Visualize and analyze user behavior with a comprehensive app usage dashboard.
